Fig. 3
Download original image
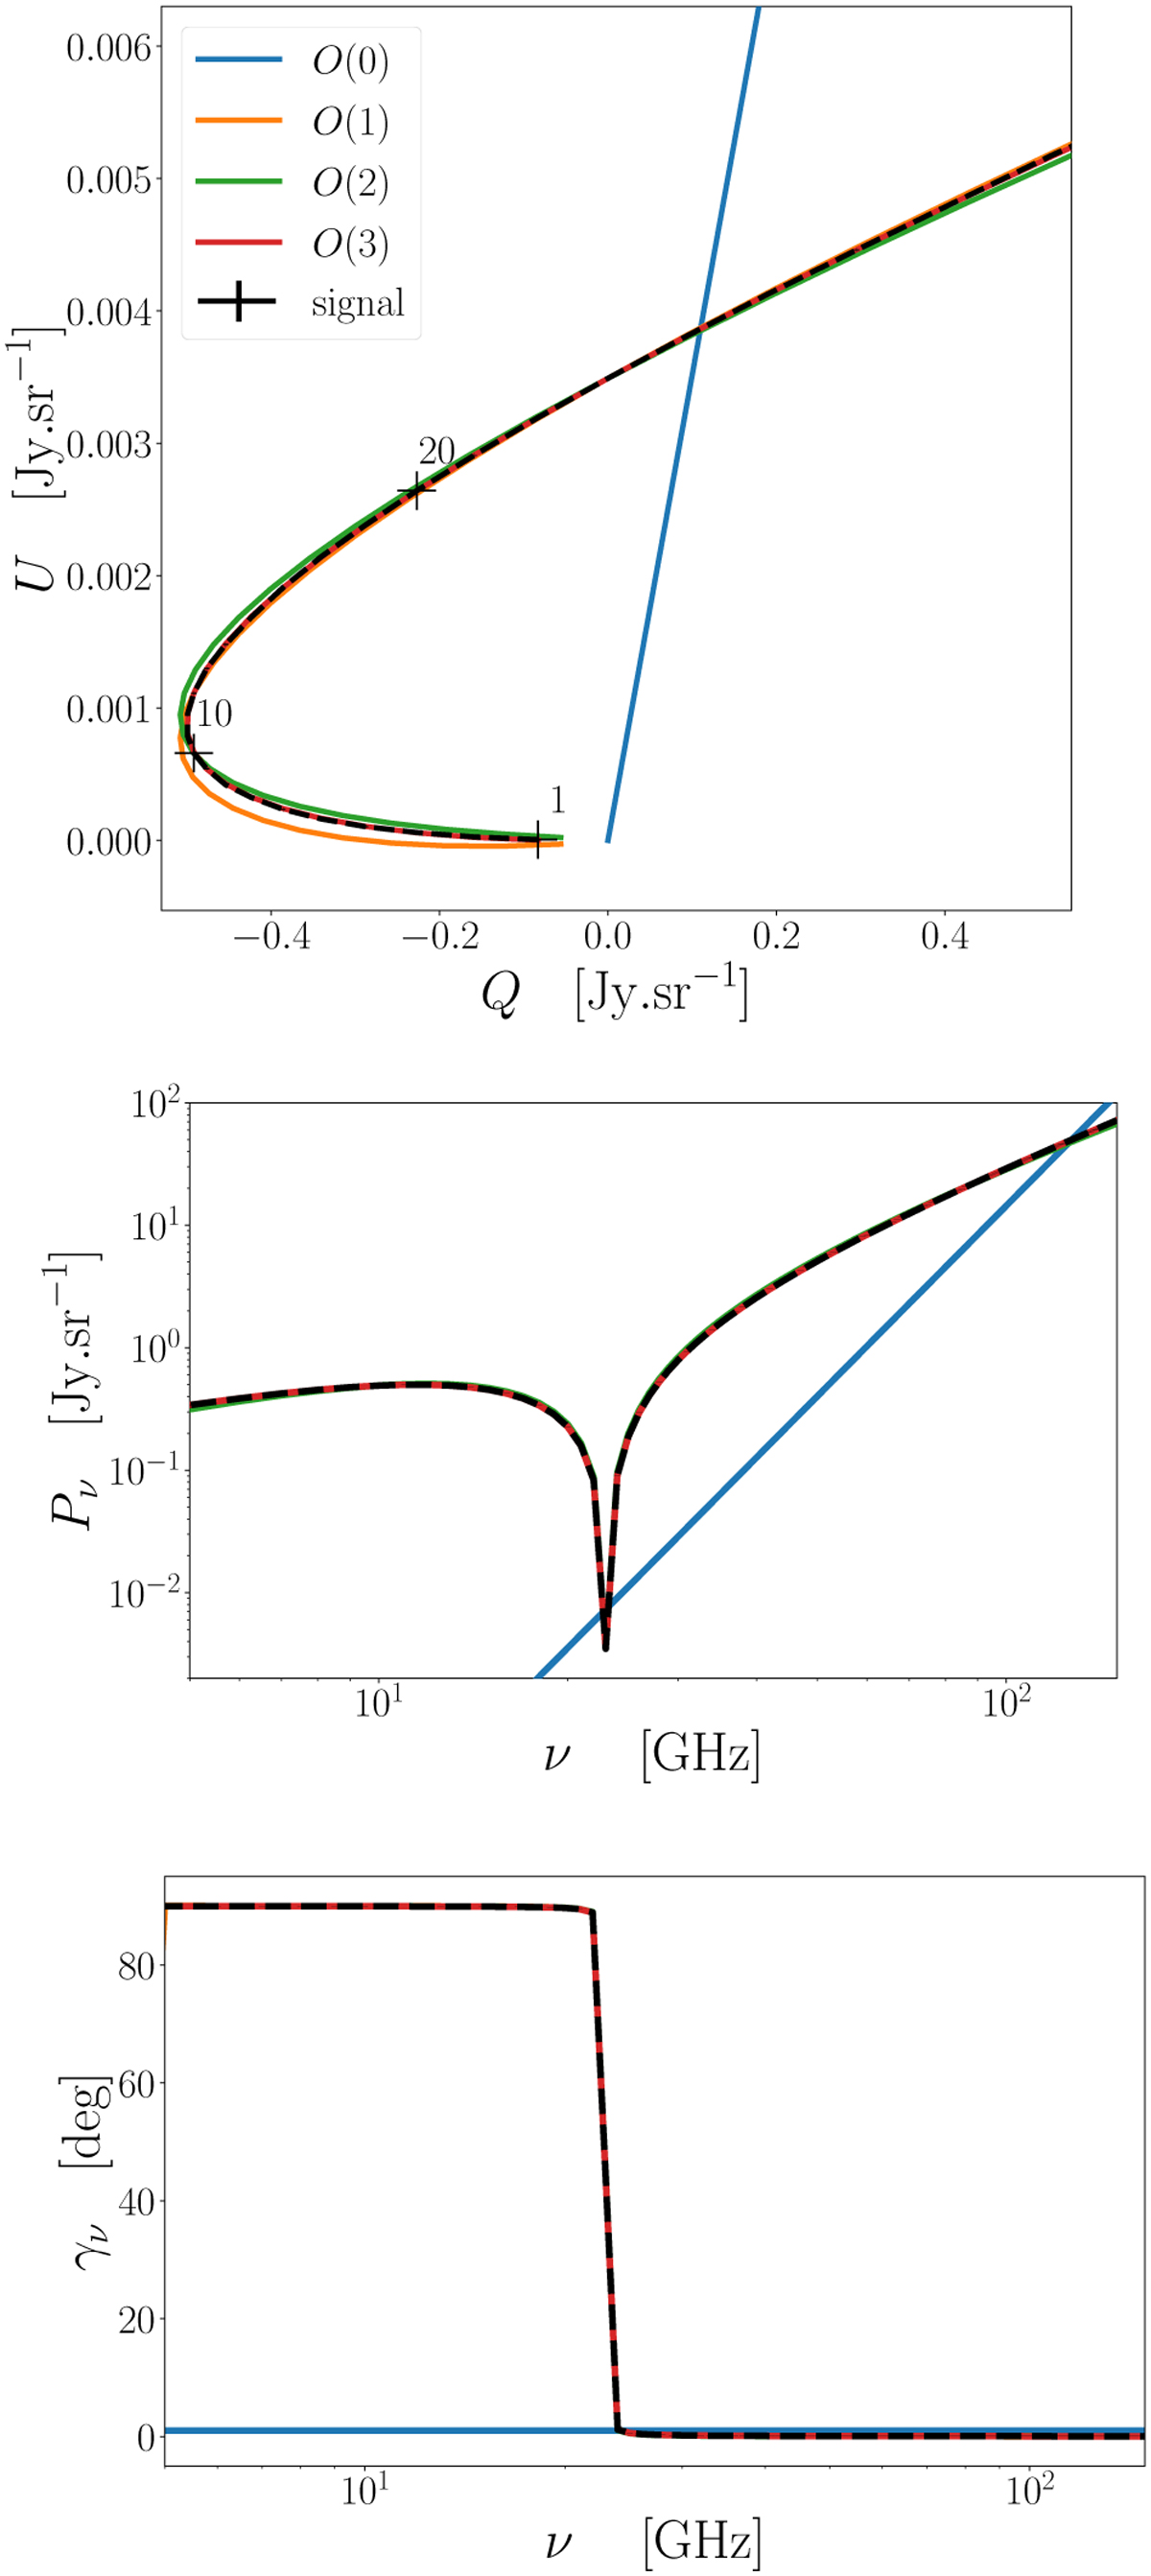
Illustration of the spinor 𝒫v in the complex plane (Q, U) for a sum of two almost anti aligned power laws, with a close-up view around v = v0 (upper panel). Black crosses mark the steps of 10 GHz on the signal. The values of frequencies are indicated above the crosses in GHz. The corresponding polarized intensity Pv (central panel) and polarization angle γv (lower panel). We choose logarithmic representations to emphasize the focus on the v ~ v0 point.
Current usage metrics show cumulative count of Article Views (full-text article views including HTML views, PDF and ePub downloads, according to the available data) and Abstracts Views on Vision4Press platform.
Data correspond to usage on the plateform after 2015. The current usage metrics is available 48-96 hours after online publication and is updated daily on week days.
Initial download of the metrics may take a while.