Open Access
Fig. 4
Download original image
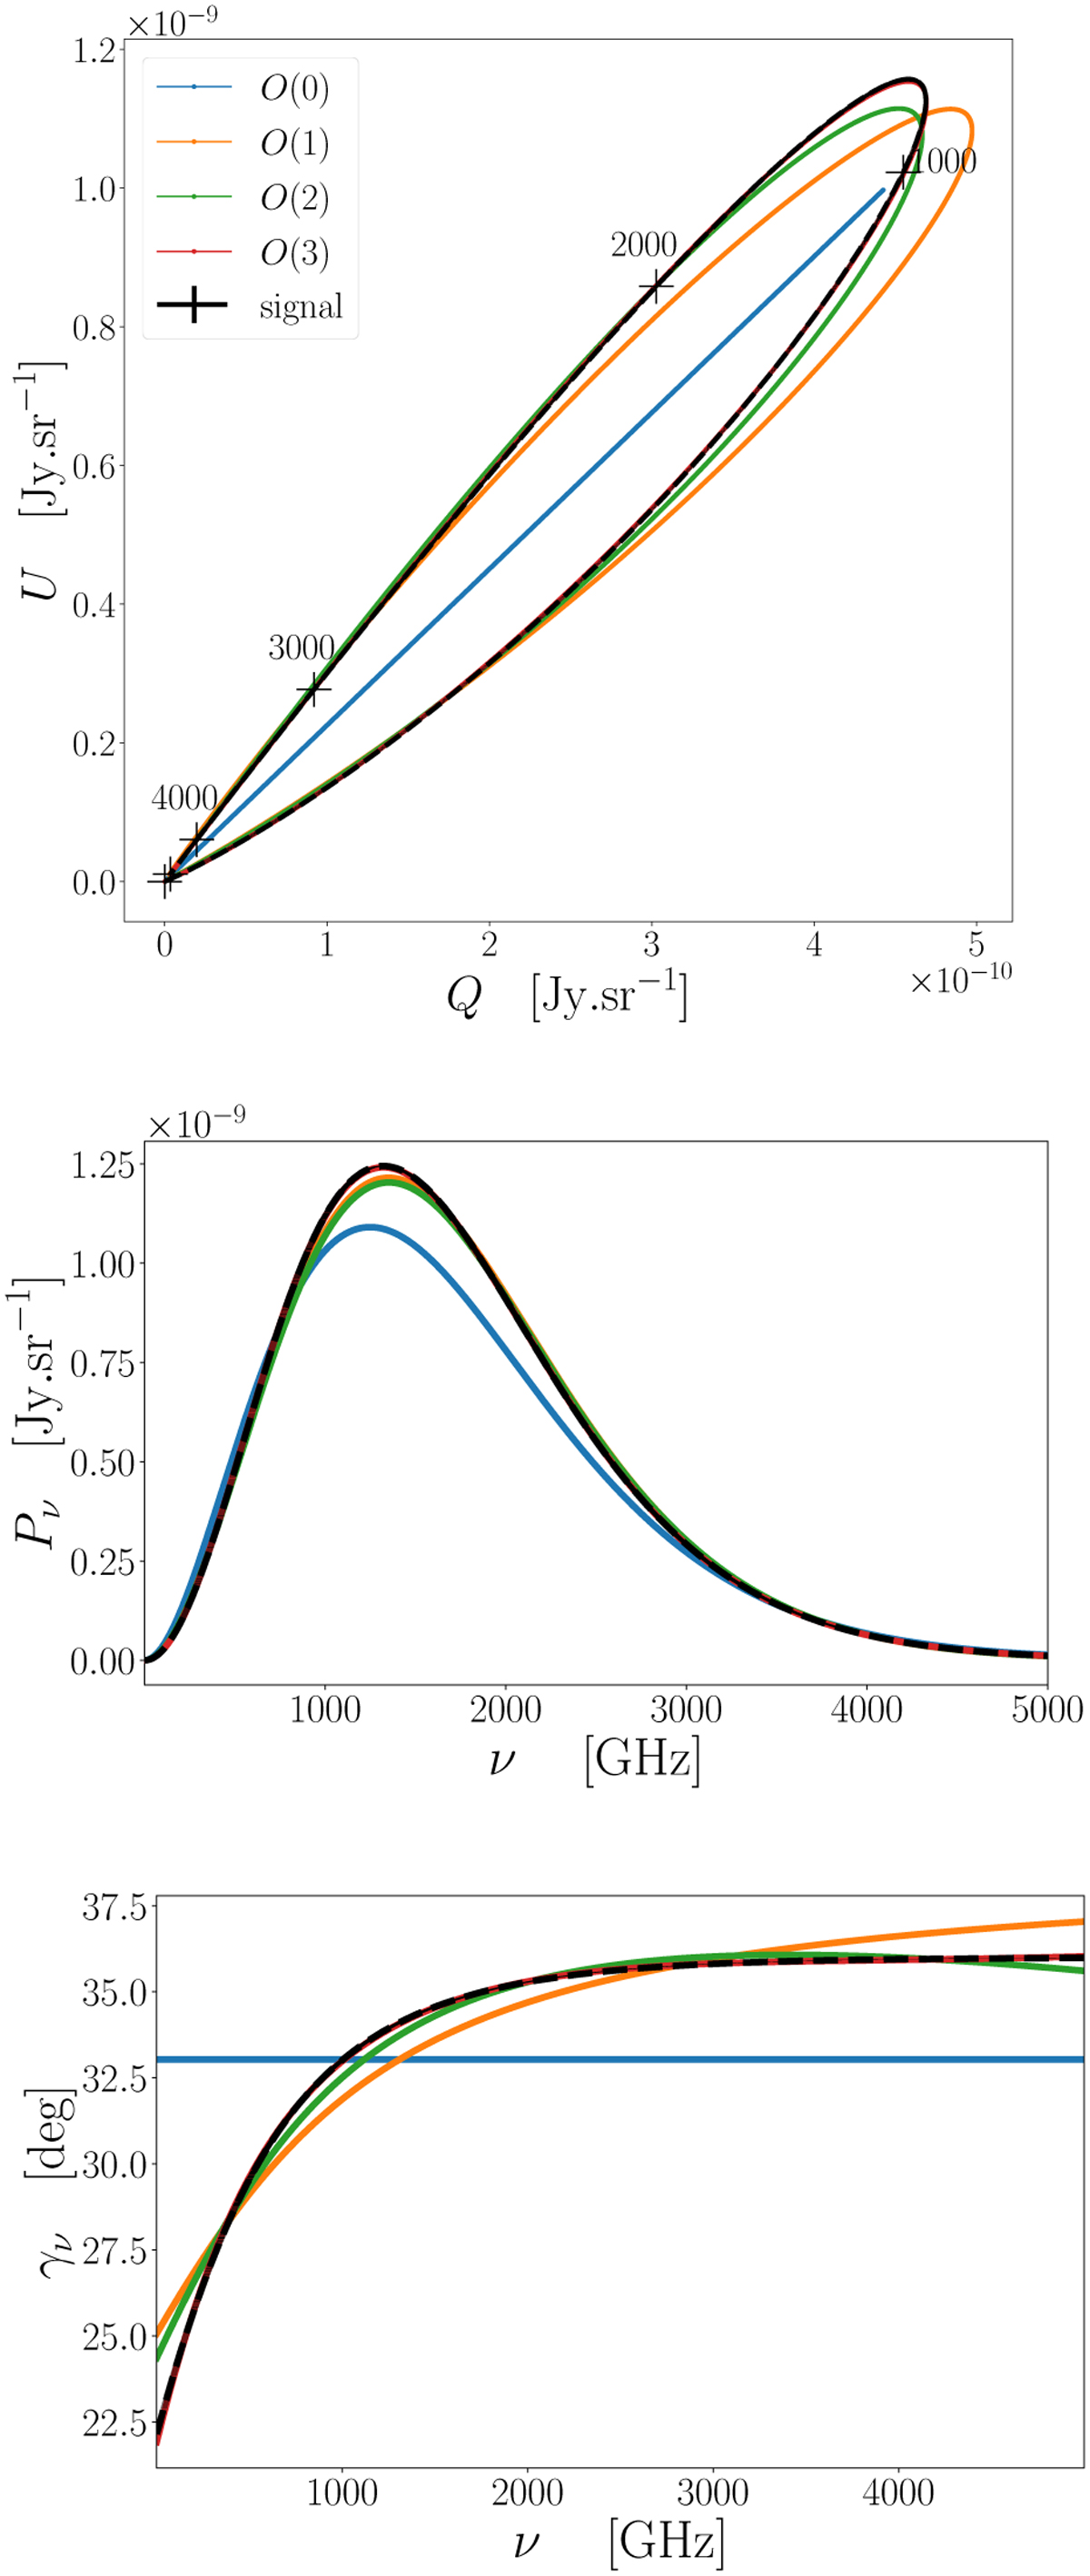
Illustration of Pv in the complex plane (Q, U) for a sum of two gray-bodies (upper panel). Black crosses mark the steps of 1000 GHz on the signal. The values of frequencies are indicated above the crosses in GHz. The corresponding polarized intensity Pν (central panel) and polarization angle γv (lowerpanel).
Current usage metrics show cumulative count of Article Views (full-text article views including HTML views, PDF and ePub downloads, according to the available data) and Abstracts Views on Vision4Press platform.
Data correspond to usage on the plateform after 2015. The current usage metrics is available 48-96 hours after online publication and is updated daily on week days.
Initial download of the metrics may take a while.