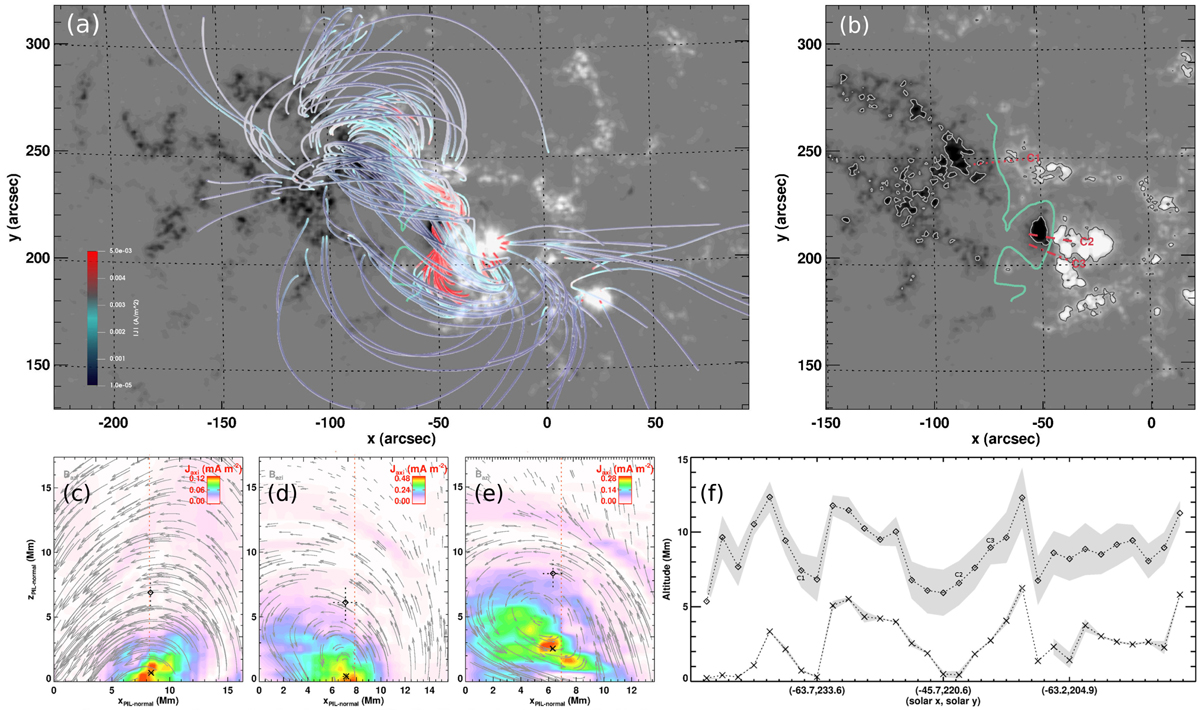
Fig. 3.
Download original image
Coronal magnetic field modeling of AR 12891 on 2021 November 2 at 00:59 UT. (a) Field line connectivity. Model field lines are drawn from randomly selected footpoints and are color coded according to the magnitude of the local electric current density. The grayscale background resembles the vertical photospheric magnetic field component, saturated at ±1 kG. (b) Vertical component of photospheric magnetic field saturated at ±1 kG. Black and white contours are drawn at ±0.75 kG. The main PIL is indicated by the green curve. Red straight lines resemble the footprints of selected vertical slices, labeled C1–C3, for which the spatial distribution of the azimuthal magnetic field (arrows) and unsigned axial electric current density (color-coded background) are shown in panels (c)–(e), respectively. Estimates of the average height of the center of the flux rope and arcade field within the selected slices are indicated as crosses and diamonds, respectively. Dashed lines indicate corresponding uncertainties. (f) Estimate of the altitude of the flux rope center (plus signs) and envelope (diamonds) along the main PIL based on 40 vertical slices distributed at regular intervals along the PIL.
Current usage metrics show cumulative count of Article Views (full-text article views including HTML views, PDF and ePub downloads, according to the available data) and Abstracts Views on Vision4Press platform.
Data correspond to usage on the plateform after 2015. The current usage metrics is available 48-96 hours after online publication and is updated daily on week days.
Initial download of the metrics may take a while.