Fig. 5.
Download original image
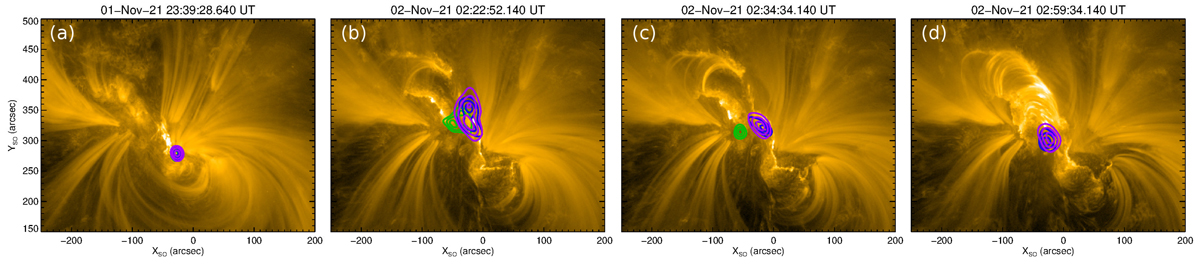
STIX images showing 4−1 keV (thermal; purple), 11−16 keV (intermediate; blue), and 16−28 keV (nonthermal; green) contours at the 50%, 70%, and 90% levels, each integrated over a two-minute period centered around a peak in the STIX 16−28 keV energy band (cf. Fig. 7b). The STIX images were generated using the maximum entropy method MEM_GE (Massa et al. 2020) with an AIA 171 Å base selected from around the mean time of the image. Units are arcseconds within the Solar Orbiter view. The AIA images have been rotated to the Solar Orbiter viewpoint.
Current usage metrics show cumulative count of Article Views (full-text article views including HTML views, PDF and ePub downloads, according to the available data) and Abstracts Views on Vision4Press platform.
Data correspond to usage on the plateform after 2015. The current usage metrics is available 48-96 hours after online publication and is updated daily on week days.
Initial download of the metrics may take a while.