Fig. 6.
Download original image
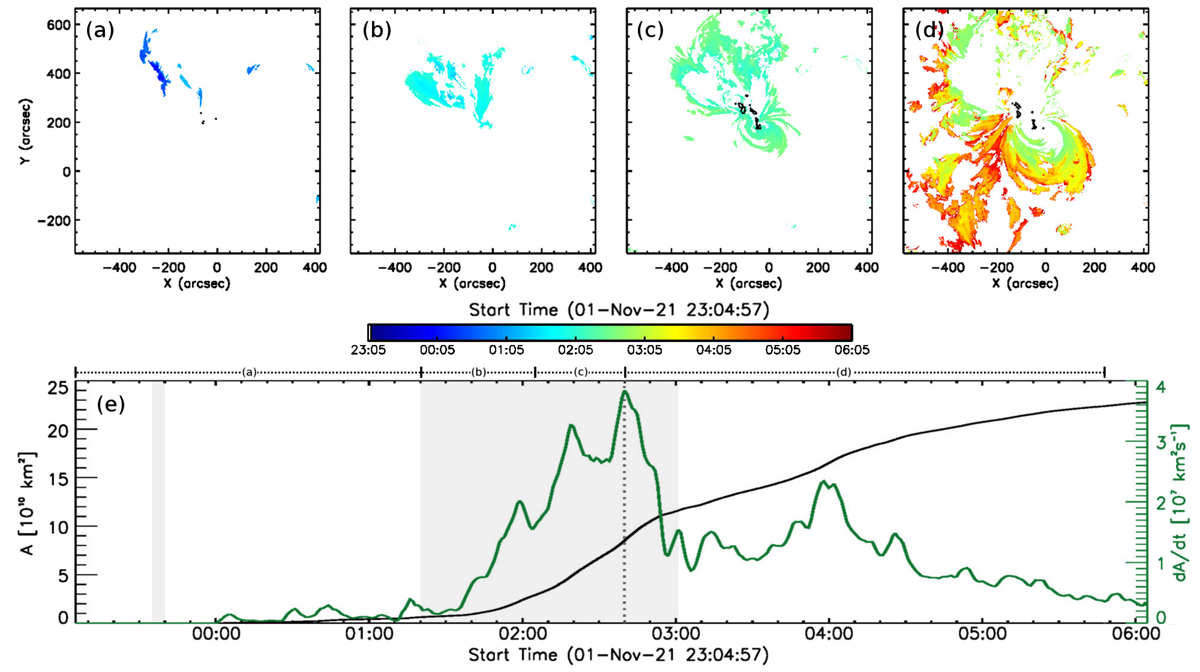
Spatial and temporal evolution of coronal dimmings and flare ribbons. Top: area newly occupied by coronal dimmings (color coded according to time) during individual episodes: (a) the C4.5 flare and a subsequent (flare-less) partial filament eruption (1 November 23:05–2 November 1:20 UT), (b) the early phase of the M1.6 flare (01:20–02:05 UT), (c) the impulsive phase of the M1.6 flare (02:05–02:40 UT), and (d) the early decay phase of the M1.7 flare (02:40–05:48 UT). The corresponding total area occupied by flare ribbons is outlined as a black contour. Bottom: cumulative dimming area (black) and instantaneous growth rate (green) as a function of time. The width of the time windows covered in (a)–(d) is indicated by dotted horizontal lines at the top axis in (e). Gray-shaded vertical bands mark the impulsive phases of flares.
Current usage metrics show cumulative count of Article Views (full-text article views including HTML views, PDF and ePub downloads, according to the available data) and Abstracts Views on Vision4Press platform.
Data correspond to usage on the plateform after 2015. The current usage metrics is available 48-96 hours after online publication and is updated daily on week days.
Initial download of the metrics may take a while.