Fig. 7.
Download original image
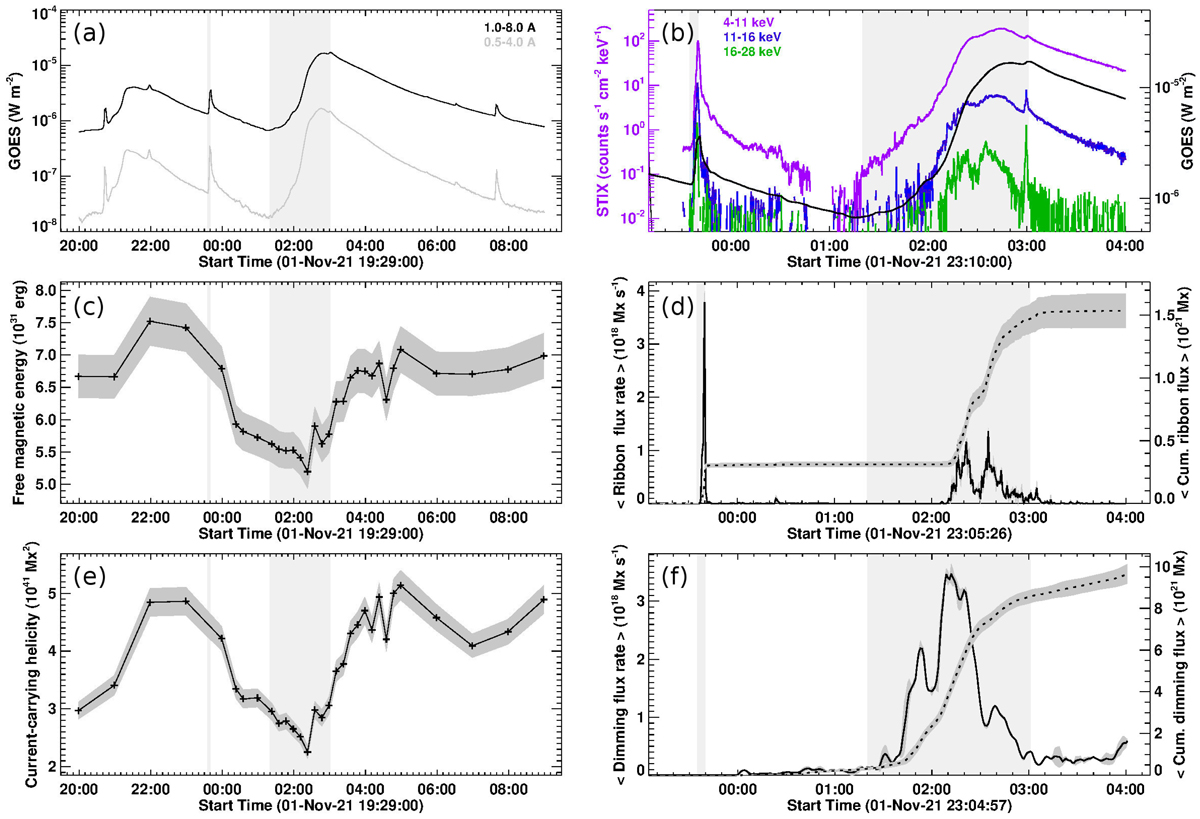
Time evolution of (a) GOES 1−8 Å (black) and 0.5−4 Å (gray) SXR flux. (b) STIX count rates at 4−11 keV (purple), 11−16 keV (blue), and 16−28 keV (green) energies together with the GOES 1−8 Å SXR flux (black). (c) Free magnetic energy. (d) Reconnection flux change rate (solid) and cumulative reconnection flux (dashed) in flare ribbons. (e) Magnitude of the helicity of the current-carrying field (|HJ|). (f) Reconnection flux change rate (solid) and cumulative reconnection flux (dashed) in dimmings. Gray-shaded vertical bands mark the impulsive phases of flares. The panels in the right column cover the time around the eruptive activity (1 November 23:00 UT–2 November 04:00 UT) while the panels in the left column cover an extended time range (1 November 20:00 UT–2 November 09:00 UT).
Current usage metrics show cumulative count of Article Views (full-text article views including HTML views, PDF and ePub downloads, according to the available data) and Abstracts Views on Vision4Press platform.
Data correspond to usage on the plateform after 2015. The current usage metrics is available 48-96 hours after online publication and is updated daily on week days.
Initial download of the metrics may take a while.