Fig. 8.
Download original image
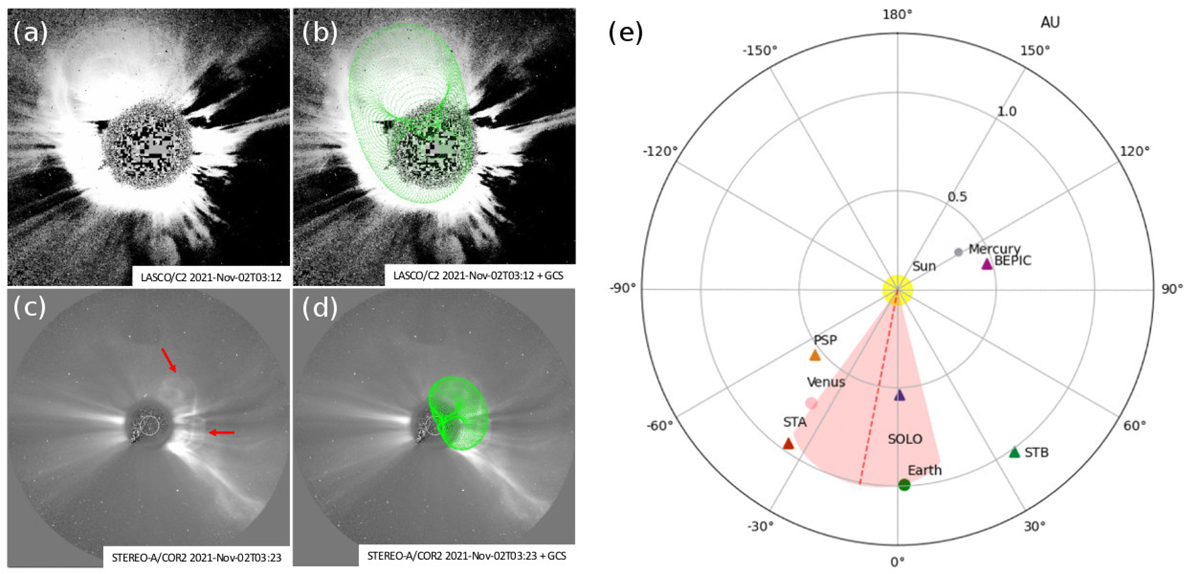
Observations and modeling of the (I)CME. Observations of the CME as seen from (a) LASCO/C2 and (c) STEREO-A. Bright emission fronts seen in STEREO-A are indicated exemplary by red arrows. GCS-reconstructed CME fronts are shown as green mesh in (b) and (d), respectively, on the respective white-light coronagraph data. (e) DBEM-based CME propagation direction (red dashed line) and width (red-shaded area) in context with the interplanetary position of operating spacecrafts (triangles) and planets (bullets).
Current usage metrics show cumulative count of Article Views (full-text article views including HTML views, PDF and ePub downloads, according to the available data) and Abstracts Views on Vision4Press platform.
Data correspond to usage on the plateform after 2015. The current usage metrics is available 48-96 hours after online publication and is updated daily on week days.
Initial download of the metrics may take a while.