Fig. 1
Download original image
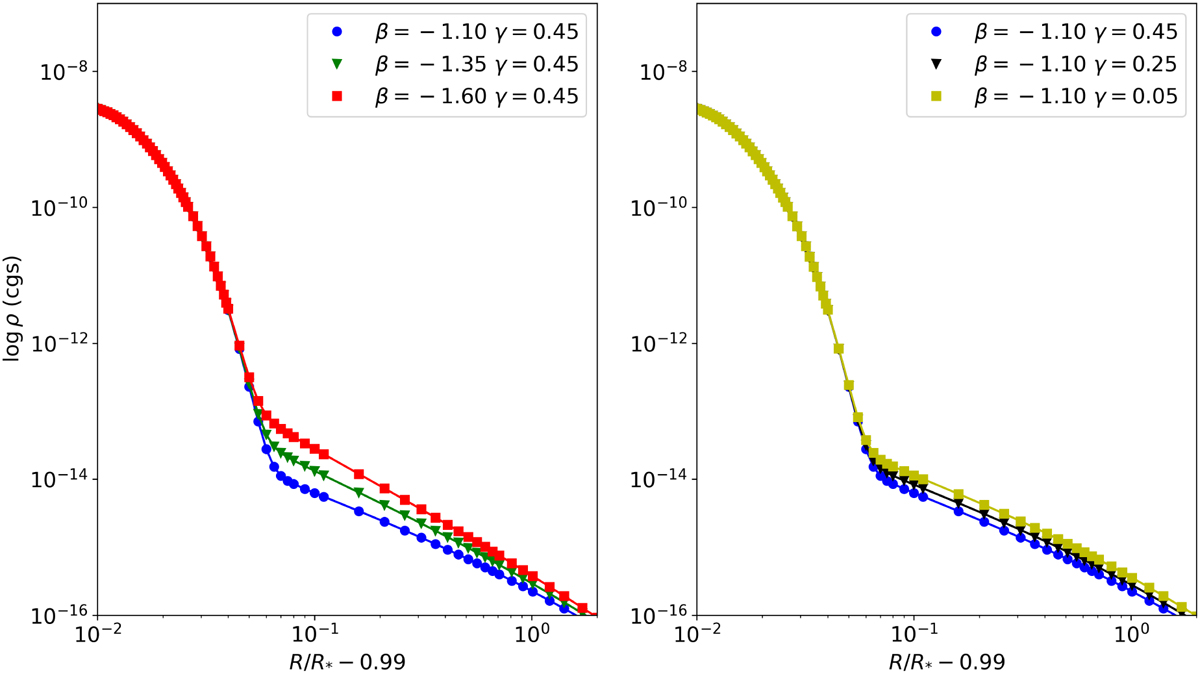
Left: different density profiles for γ = 0.45 and variations of β with β = −1.10 (blue dots), −1.35 (green triangles), and −1.60 (red squares); we noticed that as we decreased β, the wind density near R/R* − 0.99 = 10−1 increased and got steeper. Right: different density profiles for β = −1.10 and the variations of γ with γ = 0.45 (blue dots), 0.25 (black triangles), and 0.05 (yellow squares). In this case, as we increased γ, the slope of the profile remained the same, but the values of the wind density gradually increased. The model used with log L/L⊙ = 4.8, Teff = 3500 K, log g = 0.0, M = 15 M⊙, and ![]() M⊙ yr−1 corresponds to the stellar parameters of HD 95687.
M⊙ yr−1 corresponds to the stellar parameters of HD 95687.
Current usage metrics show cumulative count of Article Views (full-text article views including HTML views, PDF and ePub downloads, according to the available data) and Abstracts Views on Vision4Press platform.
Data correspond to usage on the plateform after 2015. The current usage metrics is available 48-96 hours after online publication and is updated daily on week days.
Initial download of the metrics may take a while.