Open Access
Fig. 10
Download original image
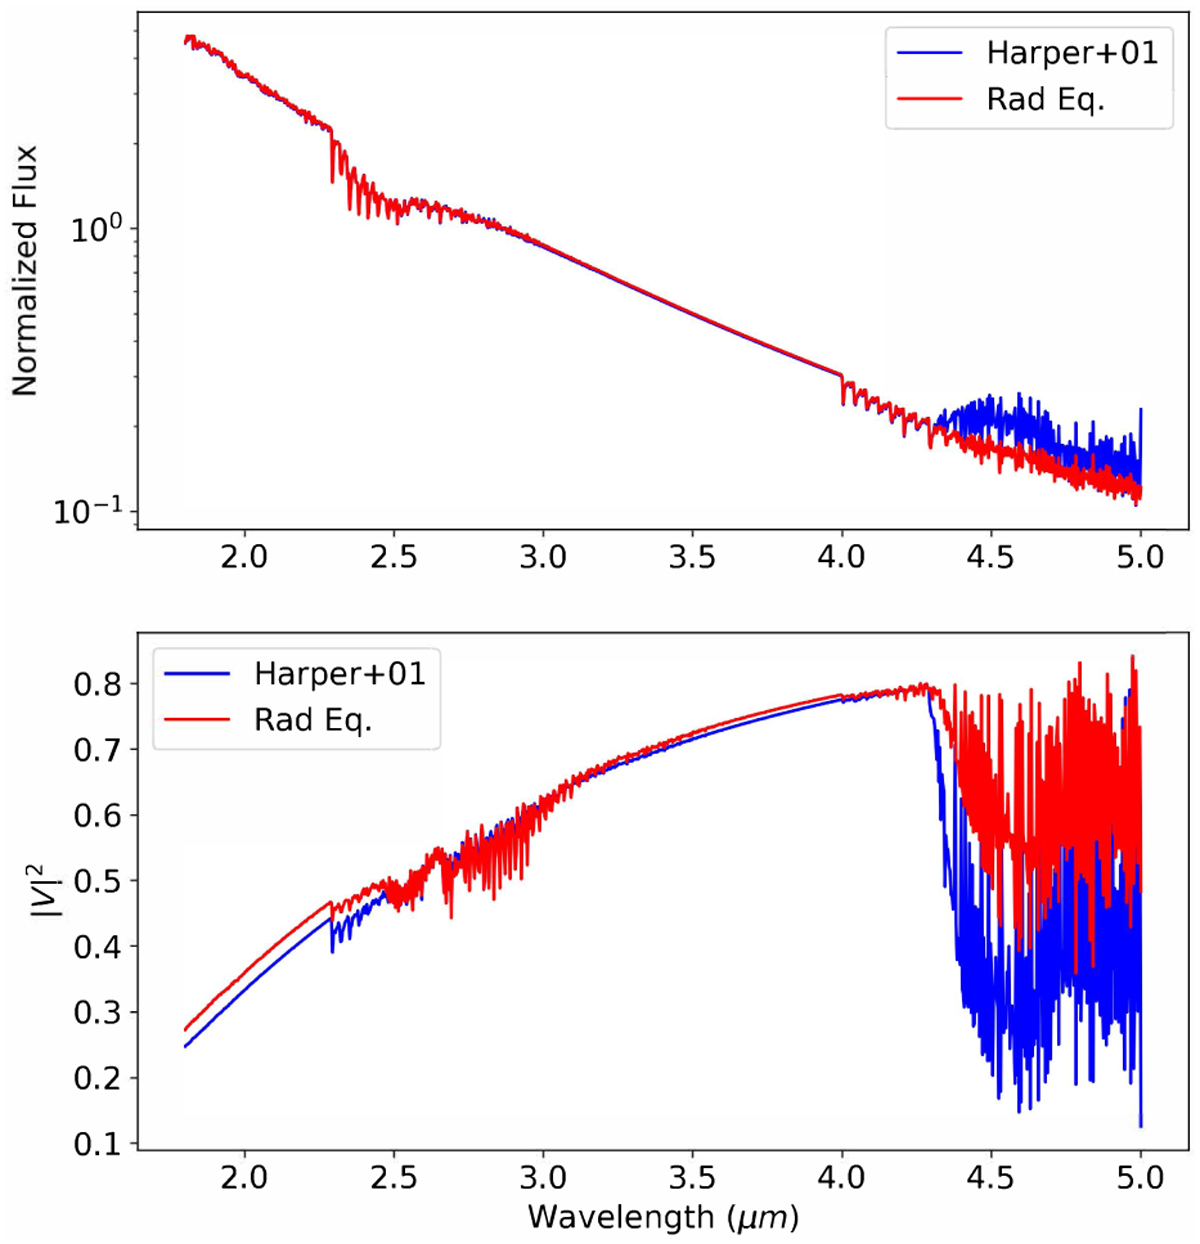
Same as Fig. 9, but with a ![]() M⊙ yr−1. In this case, the main differences are only in the λ > 4.0 µm region due to CO, where for the Harper+01 case the molecular lines appear more strongly in emission, and the visibilities are decreased due to a larger apparent diameter of the star.
M⊙ yr−1. In this case, the main differences are only in the λ > 4.0 µm region due to CO, where for the Harper+01 case the molecular lines appear more strongly in emission, and the visibilities are decreased due to a larger apparent diameter of the star.
Current usage metrics show cumulative count of Article Views (full-text article views including HTML views, PDF and ePub downloads, according to the available data) and Abstracts Views on Vision4Press platform.
Data correspond to usage on the plateform after 2015. The current usage metrics is available 48-96 hours after online publication and is updated daily on week days.
Initial download of the metrics may take a while.