Fig. 13
Download original image
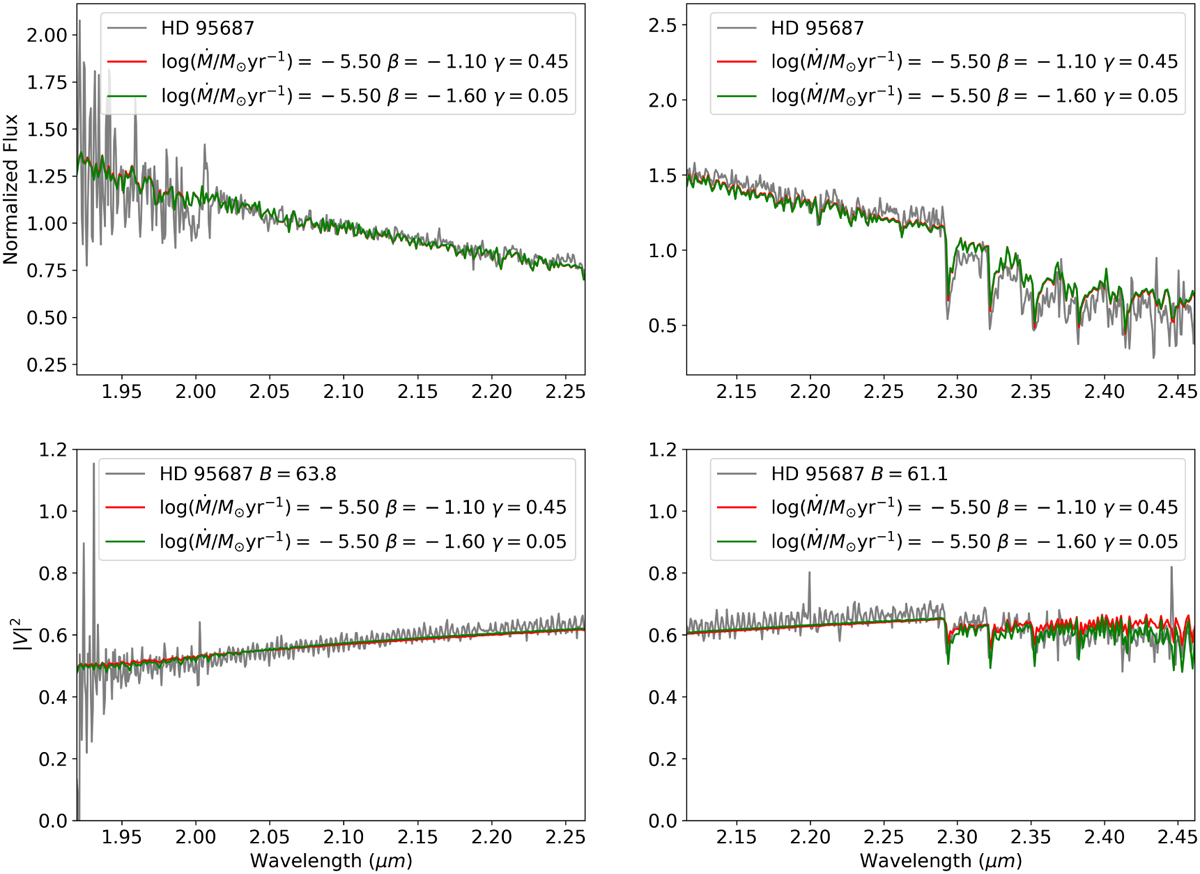
Upper left: normalised flux for the RSG HD 95687 (grey), as observed with VLT/AMBER for the K − 2.1 µm bands. Our initial best-fit model with β = −1.10 and γ = 0.45 is shown in red, corresponding to the parameters of the density profile by Harper et al. (2001). The final best-fit model with β = −1.60 and γ = 0.05 is shown in green. Upper right: same as the upper left panel, but for the K − 2.3 µm band. Lower left: same as the upper left panel, but for the |V|2 and a baseline of B = 60.8 m. Lower right: same as the lower right panel, but for the K − 2.3 µm band and a baseline of B = 63.2 m. The best-fit model for β and γ can reproduce the water features in λ = 2.29–2.5 µm with a better accuracy than our initial best fit.
Current usage metrics show cumulative count of Article Views (full-text article views including HTML views, PDF and ePub downloads, according to the available data) and Abstracts Views on Vision4Press platform.
Data correspond to usage on the plateform after 2015. The current usage metrics is available 48-96 hours after online publication and is updated daily on week days.
Initial download of the metrics may take a while.