Fig. 3
Download original image
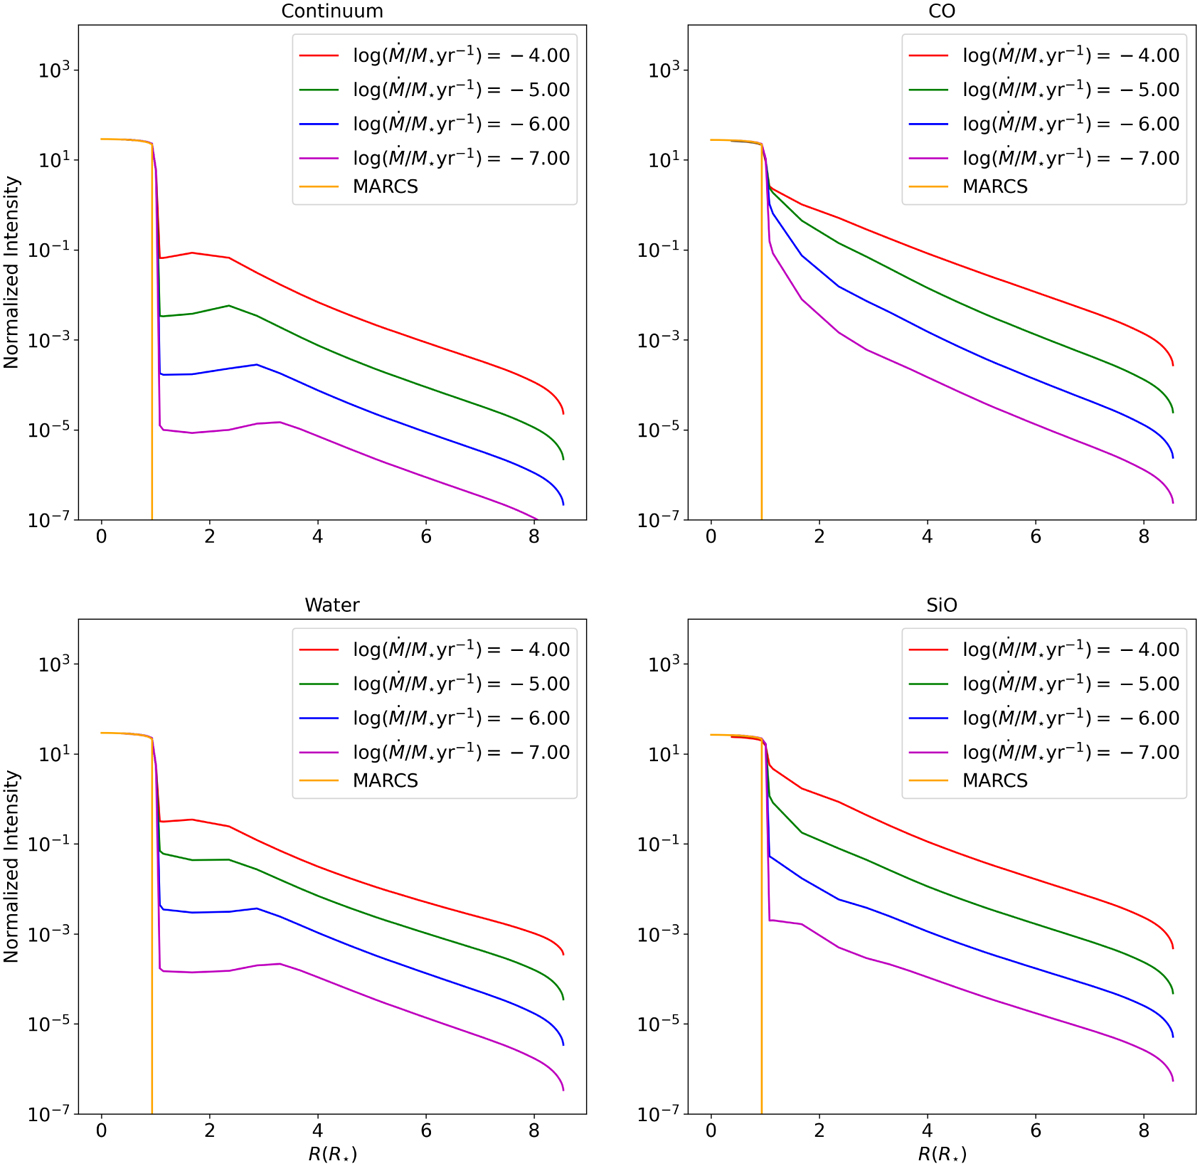
Intensity with respect to the Rmax of our model for simple MARCS (orange), ![]() (red), 10−5 (green), 10−6 (blue), and 10−7 M⊙ yr−1 (purple) and the different wavelength cuts corresponding to the following: the continuum (2.26 µm < λ < 2.28 µm, upper left), the transition CO (2–0), (λ = 2.29 µm, upper right), water (1.9 µm < λ < 2.1 µm, lower left), and SiO (λ = 4.0 µm, lower right). We observe an extension in all cases except for the MARCS model without the addition of a wind.
(red), 10−5 (green), 10−6 (blue), and 10−7 M⊙ yr−1 (purple) and the different wavelength cuts corresponding to the following: the continuum (2.26 µm < λ < 2.28 µm, upper left), the transition CO (2–0), (λ = 2.29 µm, upper right), water (1.9 µm < λ < 2.1 µm, lower left), and SiO (λ = 4.0 µm, lower right). We observe an extension in all cases except for the MARCS model without the addition of a wind.
Current usage metrics show cumulative count of Article Views (full-text article views including HTML views, PDF and ePub downloads, according to the available data) and Abstracts Views on Vision4Press platform.
Data correspond to usage on the plateform after 2015. The current usage metrics is available 48-96 hours after online publication and is updated daily on week days.
Initial download of the metrics may take a while.