Fig. 4
Download original image
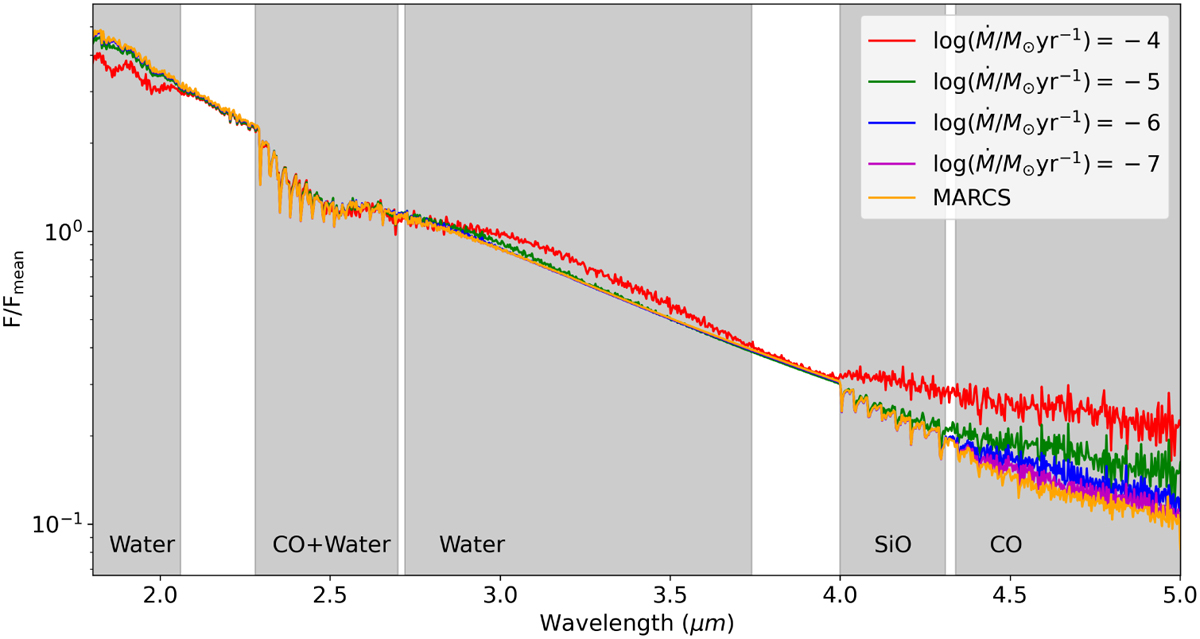
Normalised model spectra with respect to the mean flux for ![]() (red), 10−5 (green), 10−6 (blue), and 10−7 M⊙ yr−1 (purple). We also plotted the spectra and visibilities based on the MARCS model without a wind (orange). This is the case for R.E. We have convolved the results with the spectral resolution of R = 1000. The main differences within models can be seen in the water, CO, and SiO molecular bands, the corresponding wavelength regions are highlighted in light grey.
(red), 10−5 (green), 10−6 (blue), and 10−7 M⊙ yr−1 (purple). We also plotted the spectra and visibilities based on the MARCS model without a wind (orange). This is the case for R.E. We have convolved the results with the spectral resolution of R = 1000. The main differences within models can be seen in the water, CO, and SiO molecular bands, the corresponding wavelength regions are highlighted in light grey.
Current usage metrics show cumulative count of Article Views (full-text article views including HTML views, PDF and ePub downloads, according to the available data) and Abstracts Views on Vision4Press platform.
Data correspond to usage on the plateform after 2015. The current usage metrics is available 48-96 hours after online publication and is updated daily on week days.
Initial download of the metrics may take a while.