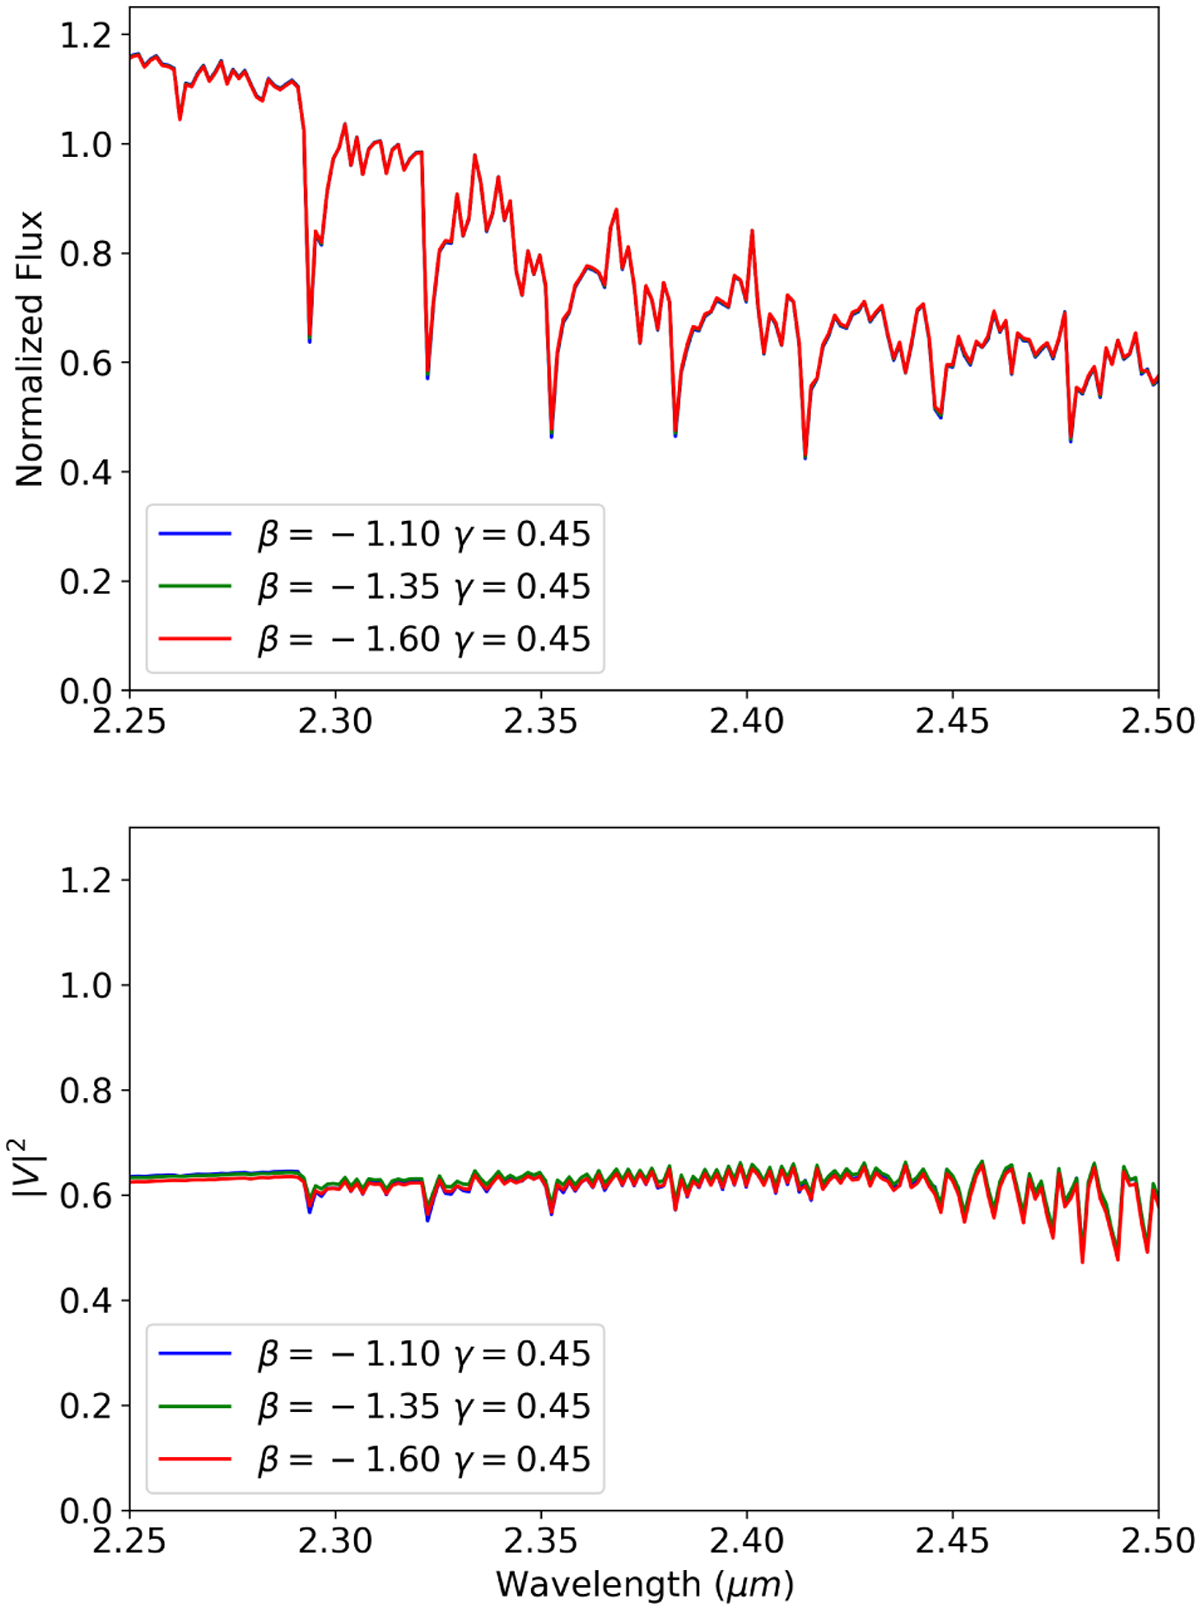
Fig. 7
Download original image
Normalised model spectra (upperpanel) and |V|2 (lower panel) for a fixed γ = 0.45 and the different β = −1.10 (blue), −1.35 (green), and −1.60 (red) in the K-band. The baseline used is B = 63.8 m, corresponding to the case study of HD 95687 in Sect. 4. We can see that as the β gets lower, the water features in λ = 2.35–2.5 µm become slightly more prominent.
Current usage metrics show cumulative count of Article Views (full-text article views including HTML views, PDF and ePub downloads, according to the available data) and Abstracts Views on Vision4Press platform.
Data correspond to usage on the plateform after 2015. The current usage metrics is available 48-96 hours after online publication and is updated daily on week days.
Initial download of the metrics may take a while.