Fig. 9
Download original image
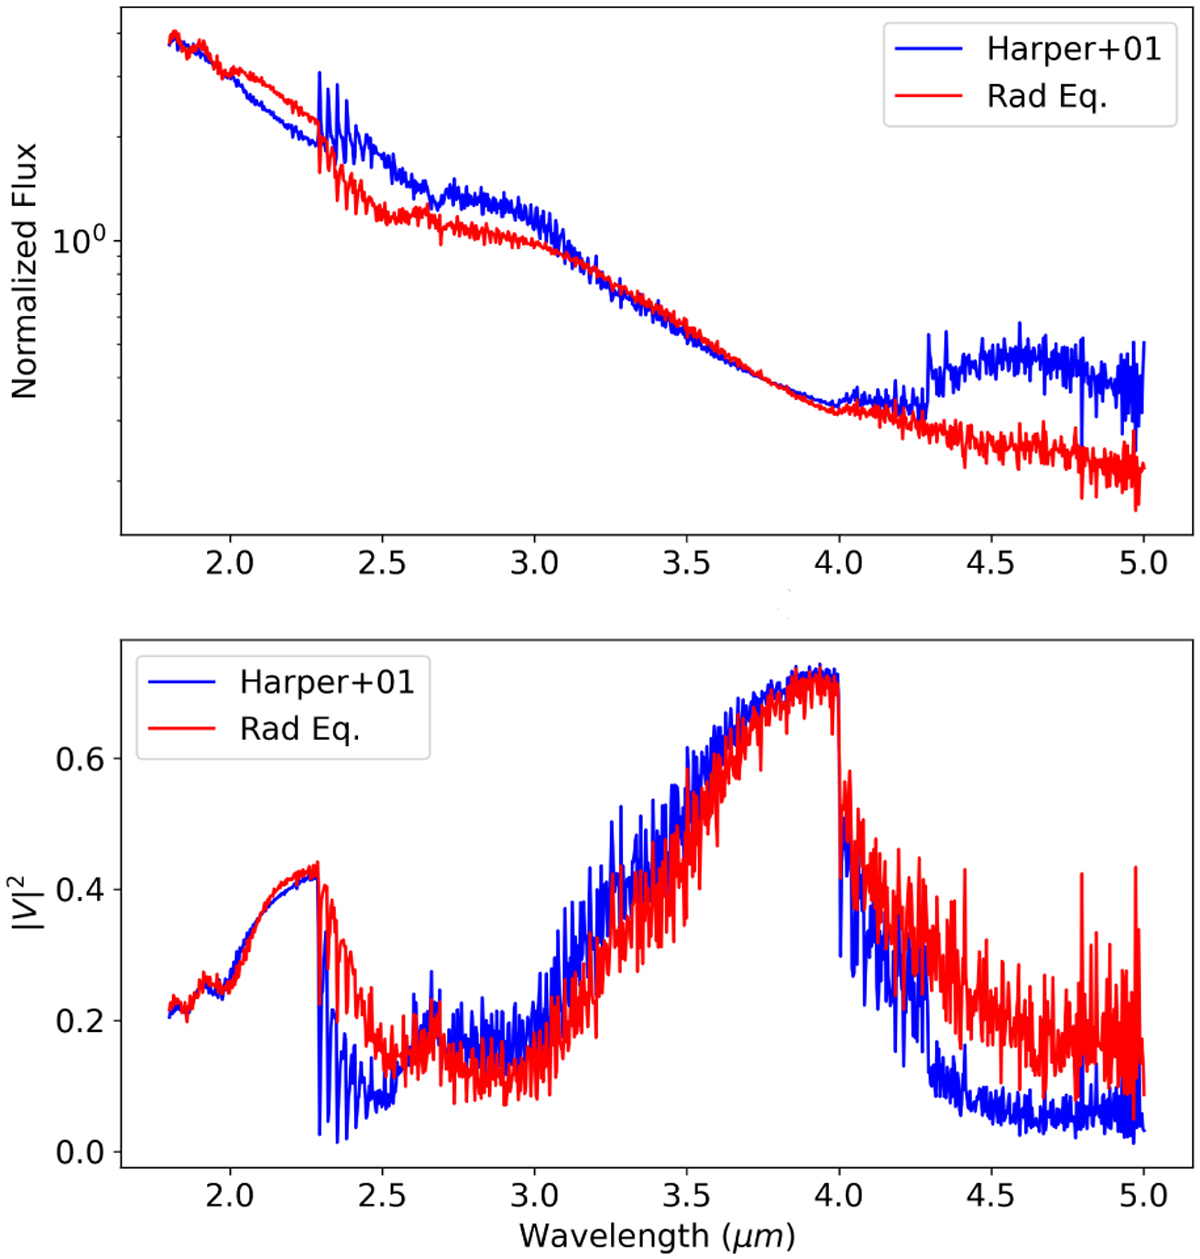
Normalised model spectra (upper panel) and |V|2 (lower panel) for our base model with simple radiative equilibrium (red) and the chromospheric temperature inversion profile by Harper et al. (2001; blue). Both models with a ![]() M⊙ yr−1. We can see that the main differences are in the regions λ = 2.35–3.0 µm and λ > 4.0 µm due to CO, where for the Harper+01 case the molecular lines appear more strongly in emission, and the visibilities are decreased due to a larger apparent diameter of the star.
M⊙ yr−1. We can see that the main differences are in the regions λ = 2.35–3.0 µm and λ > 4.0 µm due to CO, where for the Harper+01 case the molecular lines appear more strongly in emission, and the visibilities are decreased due to a larger apparent diameter of the star.
Current usage metrics show cumulative count of Article Views (full-text article views including HTML views, PDF and ePub downloads, according to the available data) and Abstracts Views on Vision4Press platform.
Data correspond to usage on the plateform after 2015. The current usage metrics is available 48-96 hours after online publication and is updated daily on week days.
Initial download of the metrics may take a while.