Fig. 15
Download original image
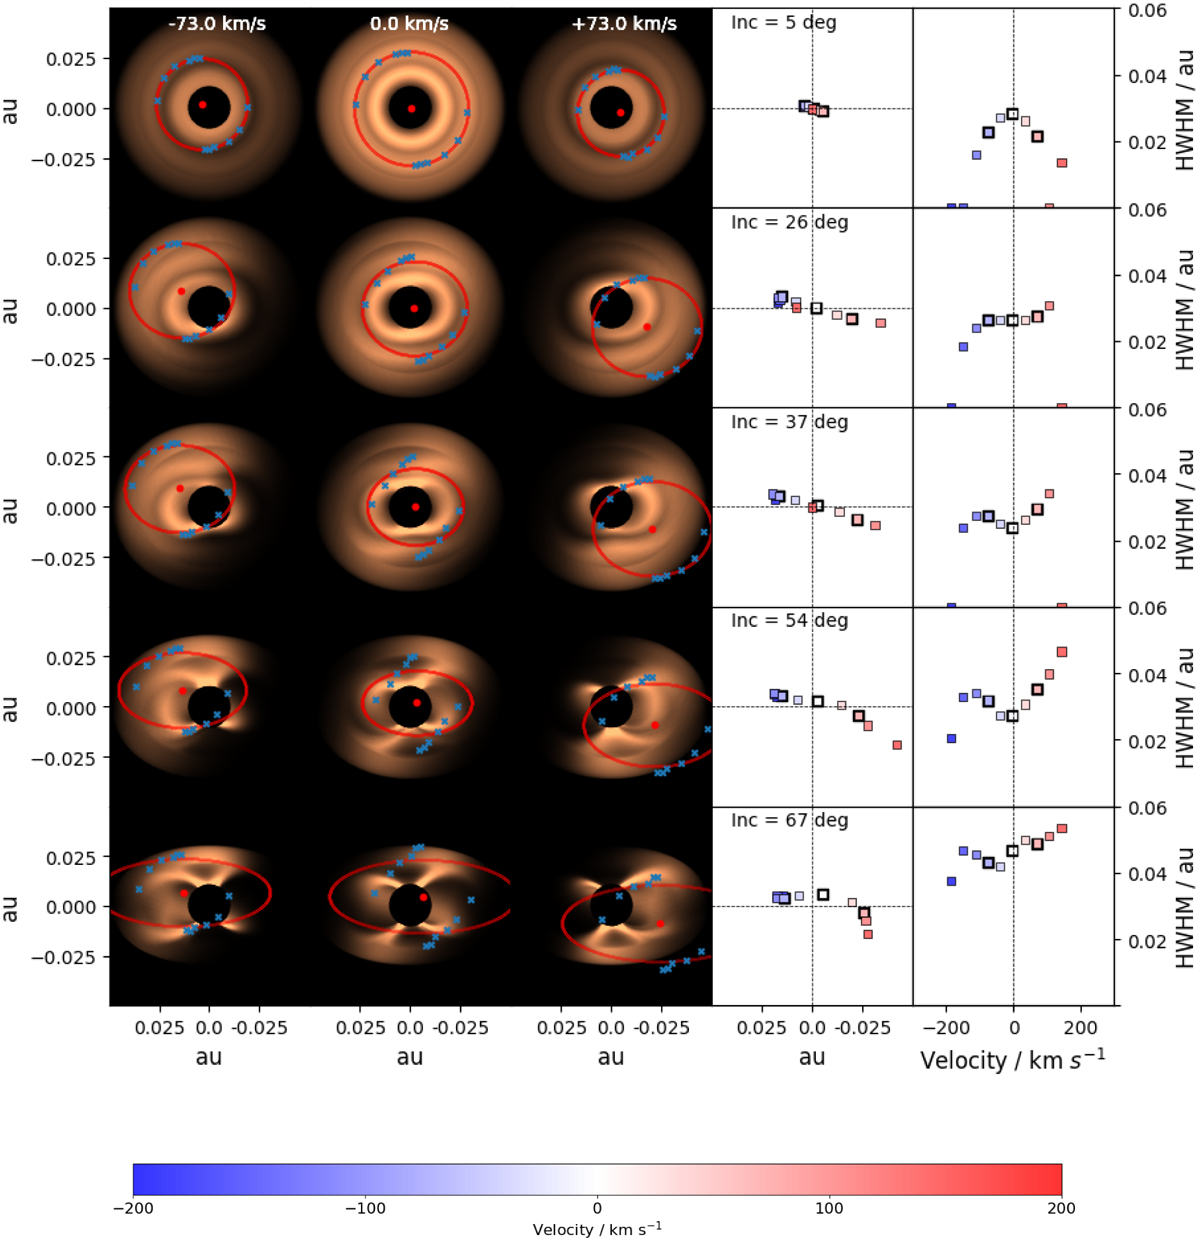
Model images and derived quantities of the Brγ emission region. The three columns on the left show the continuum-subtracted Brγ emission region image at three different velocities, while the two columns on the right show the photocentre shift profile and the size profile across all velocity components of the Brγ line, for a range of inclinations between 5° and 67°. The model images correspond to the blue, white and red channels marked with a bold black outline, and the photocentres and region sizes in those particular channels are defined by the red dots and the semi-major axes of the red ellipses, respectively. Only the semi-major axis of the ellipse is left as a free parameter of the fit, which emulates the approach taken with the observational data. Figure 16 shows the corresponding profiles if inclination and position angle are also free parameters of the fit.
Current usage metrics show cumulative count of Article Views (full-text article views including HTML views, PDF and ePub downloads, according to the available data) and Abstracts Views on Vision4Press platform.
Data correspond to usage on the plateform after 2015. The current usage metrics is available 48-96 hours after online publication and is updated daily on week days.
Initial download of the metrics may take a while.