Fig. 18
Download original image
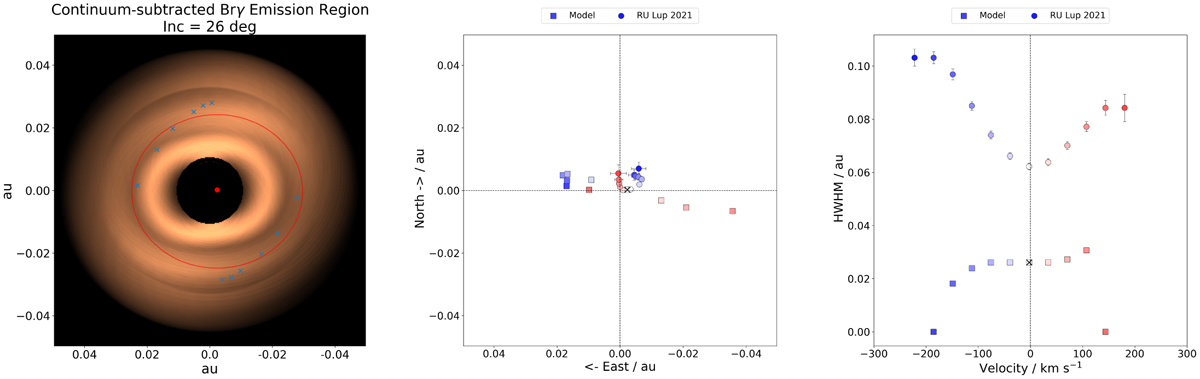
Model image and derived quantities for an RU Lup-like system. Left: a continuum subtracted model image of the magnetosphere at 26° inclination, representing the pure line emission region at the central channel of the Brγ line. The size of the region and its photocentre, depicted here as ellipse and red dot, were both determined from the synthetic observables in a process analogous to the way the GRAVITY data were treated. Centre: the model photocentre shift profile across the line, compared to the results for RU Lup 2021. The model profile is largely aligned along a single axis, while the observational profile shows a significantly higher degree of complexity. Right: variation of emission region size across the line. While the size of the magnetosphere is an input parameter of the model, the change of the half flux radii at different velocities still provides a useful baseline to which the trends in the sample can be compared. The observational profile shows a region more than twice the size of the model HWHM at the central channel, growing larger at the line edges, whereas the model predicts a decline in size in the wings of the line.
Current usage metrics show cumulative count of Article Views (full-text article views including HTML views, PDF and ePub downloads, according to the available data) and Abstracts Views on Vision4Press platform.
Data correspond to usage on the plateform after 2015. The current usage metrics is available 48-96 hours after online publication and is updated daily on week days.
Initial download of the metrics may take a while.