Fig. A.1
Download original image
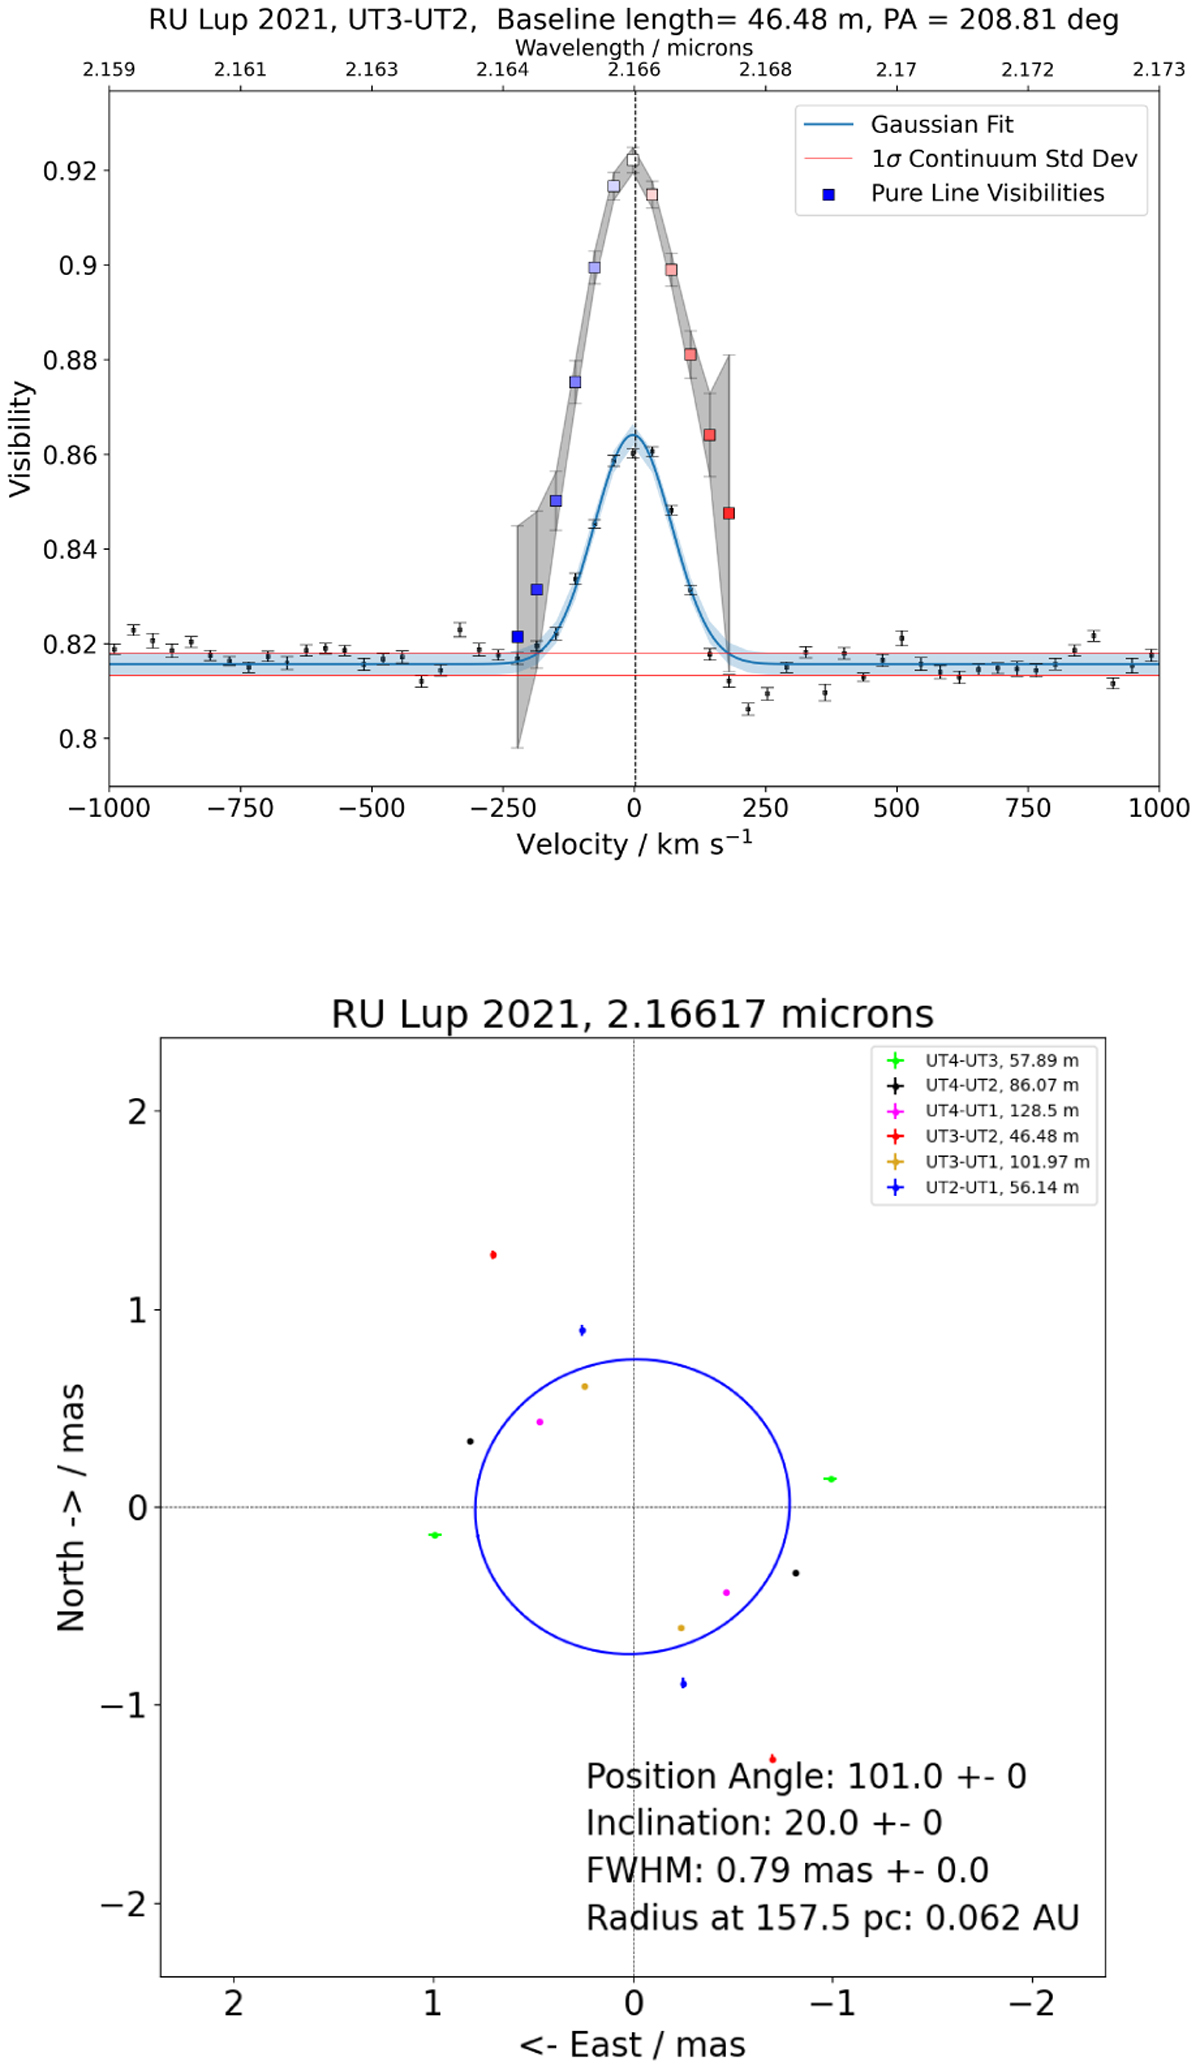
Fitting of the visibility amplitude data.
Top: Visibility data from the UT3-UT2 baseline of the RU Lup observation in 2021. The coloured squares indicate the pure line visibilities after the extraction of the continuum contribution from the Brγ signal as laid out in Eq. A.1. Bottom: An ellipse representing the 2D emission region as projected onto the six baselines of GRAVITY in a single spectral channel. We used a Gaussian disk model to determine the projected half width at half maximum (HWHM) at each baseline and then fitted an ellipse to this set of points to obtain the HWHM of an inclined 2D Gaussian. The overall HWHM of the region is then given by the semi-major axis of the ellipse.
Current usage metrics show cumulative count of Article Views (full-text article views including HTML views, PDF and ePub downloads, according to the available data) and Abstracts Views on Vision4Press platform.
Data correspond to usage on the plateform after 2015. The current usage metrics is available 48-96 hours after online publication and is updated daily on week days.
Initial download of the metrics may take a while.