Fig. 2
Download original image
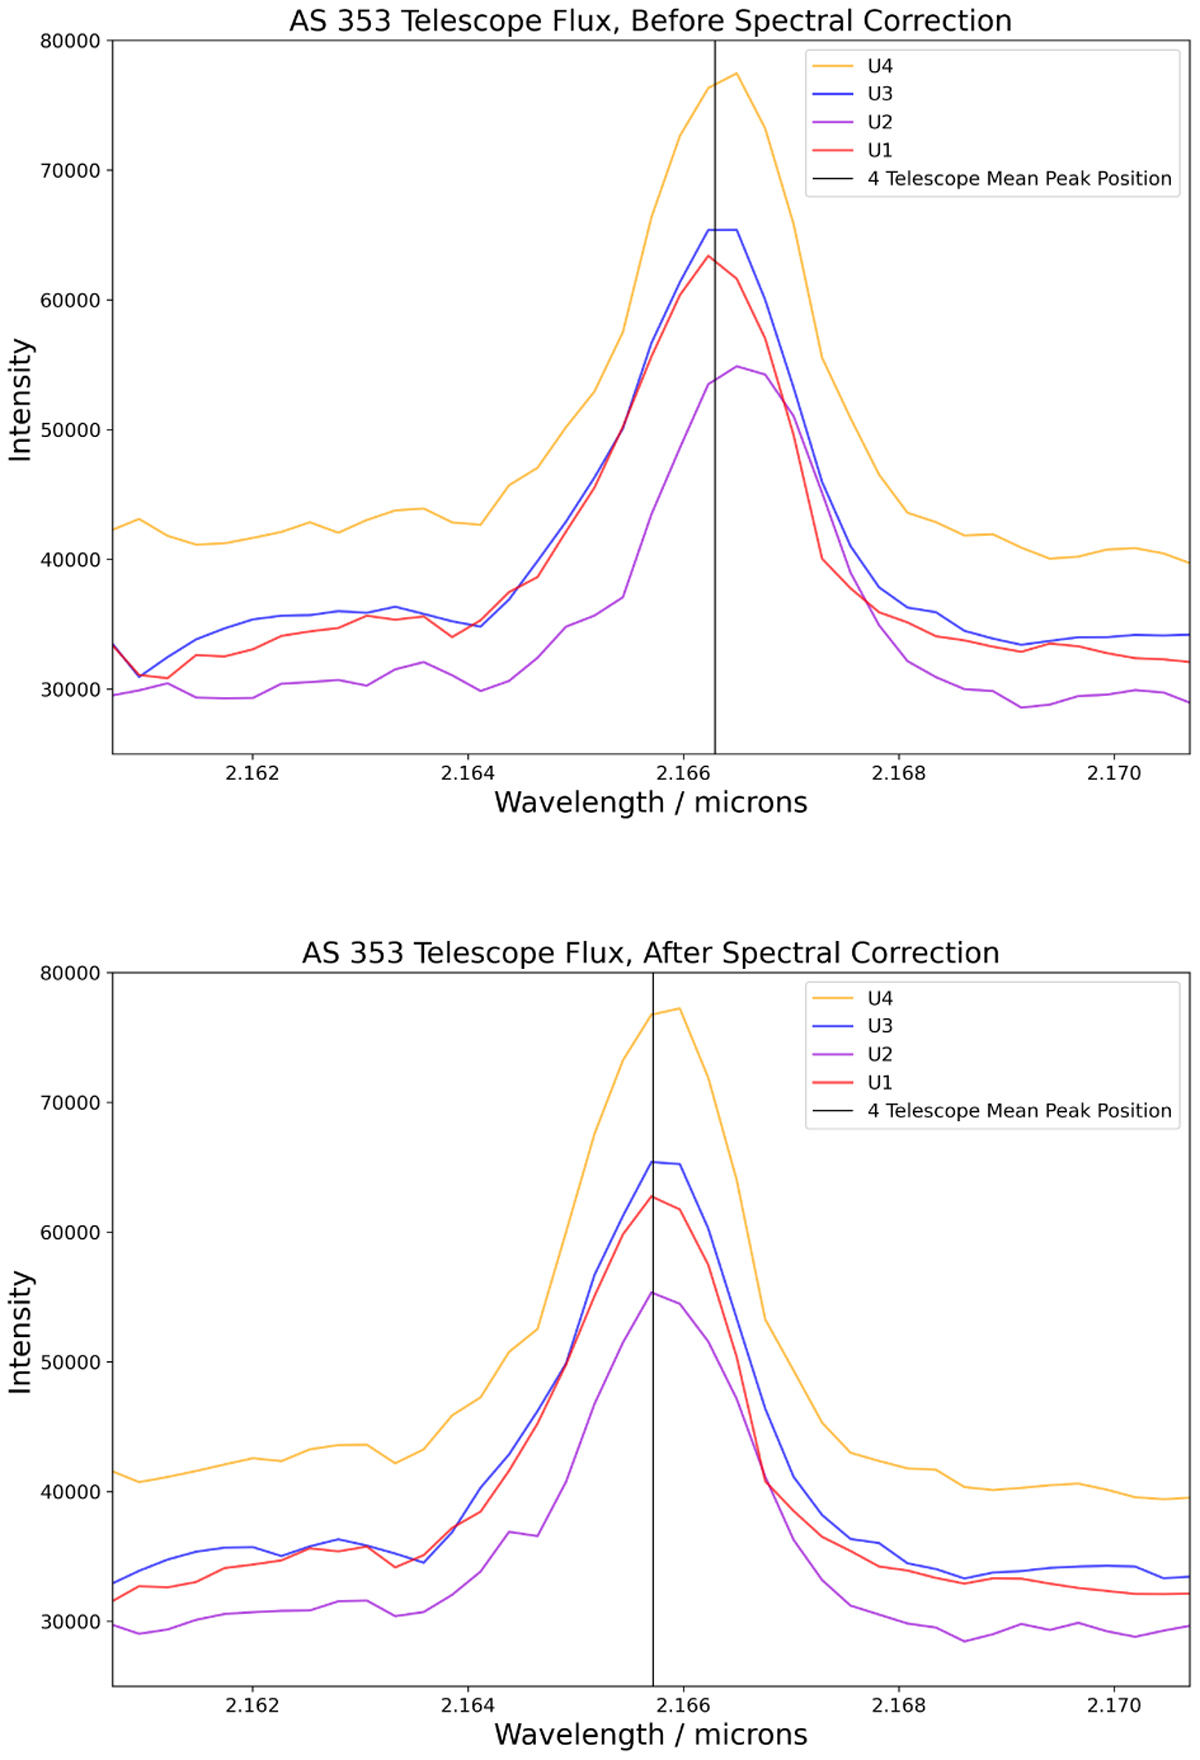
Brγ spectra of the AS 353 observation, taken with the four unit telescopes of the VLTI. Top: the spectra before the application of the spectral calibration. The vertical line indicates the mean position of the line peak. Before the correction, the individual spectra for most of our objects were misaligned both with respect to the telluric lines and also between each other. Bottom: same spectra after they were brought into alignment through the spectral calibration. The corrected spectra and recomputed observables were then further shifted to bring them to the local standard of rest (LSR).
Current usage metrics show cumulative count of Article Views (full-text article views including HTML views, PDF and ePub downloads, according to the available data) and Abstracts Views on Vision4Press platform.
Data correspond to usage on the plateform after 2015. The current usage metrics is available 48-96 hours after online publication and is updated daily on week days.
Initial download of the metrics may take a while.