Fig. A.2
Download original image
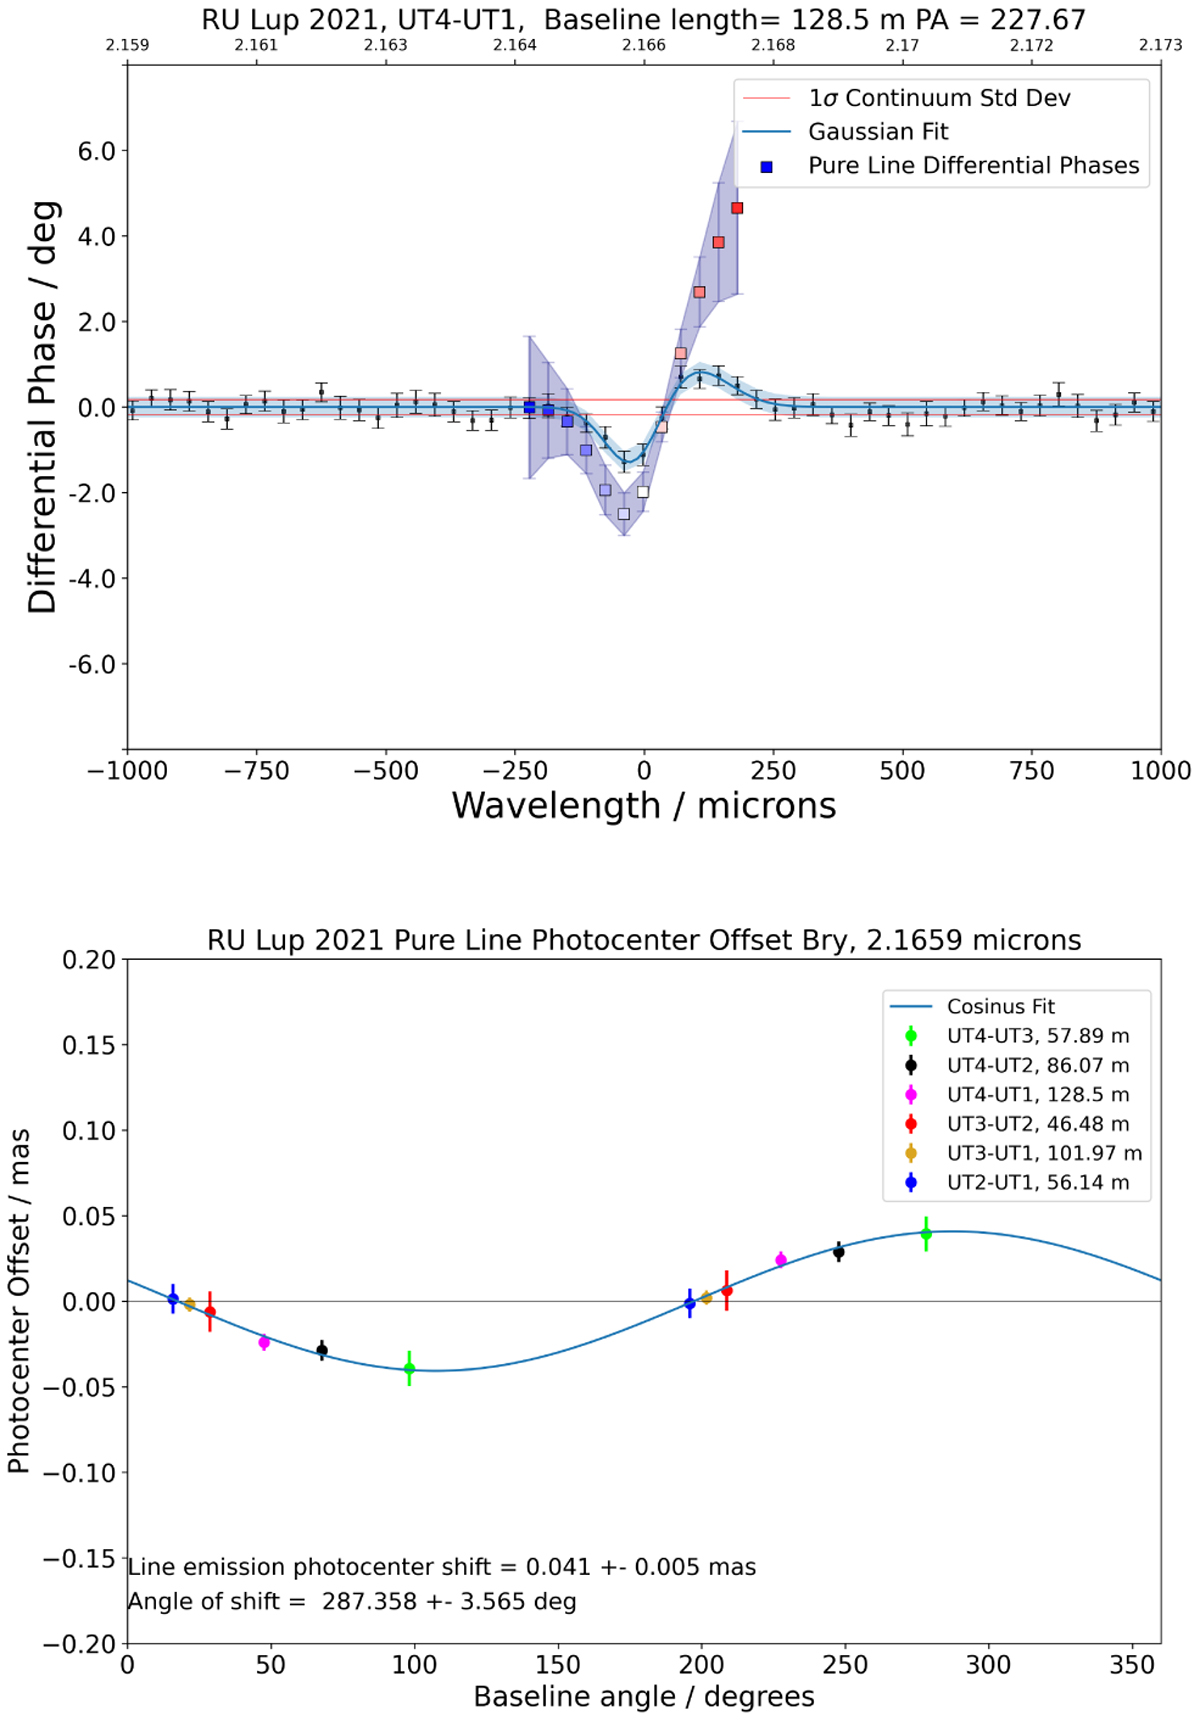
Fitting of the differential phase data.
Top: Differential phase data from the UT4-UT1 baseline of the RU Lup observation in 2021. Here the coloured squares indicate again the pure line differential phases, excluding the influence of the continuum via Eq. A.5.
Bottom: From the pure line differential phases we obtained the photocentre shifts as projected onto the six baselines. We deprojected the overall shift vector by fitting a cosine function to the projected shift magnitudes at the respective baseline angles.
Current usage metrics show cumulative count of Article Views (full-text article views including HTML views, PDF and ePub downloads, according to the available data) and Abstracts Views on Vision4Press platform.
Data correspond to usage on the plateform after 2015. The current usage metrics is available 48-96 hours after online publication and is updated daily on week days.
Initial download of the metrics may take a while.