Fig. 3
Download original image
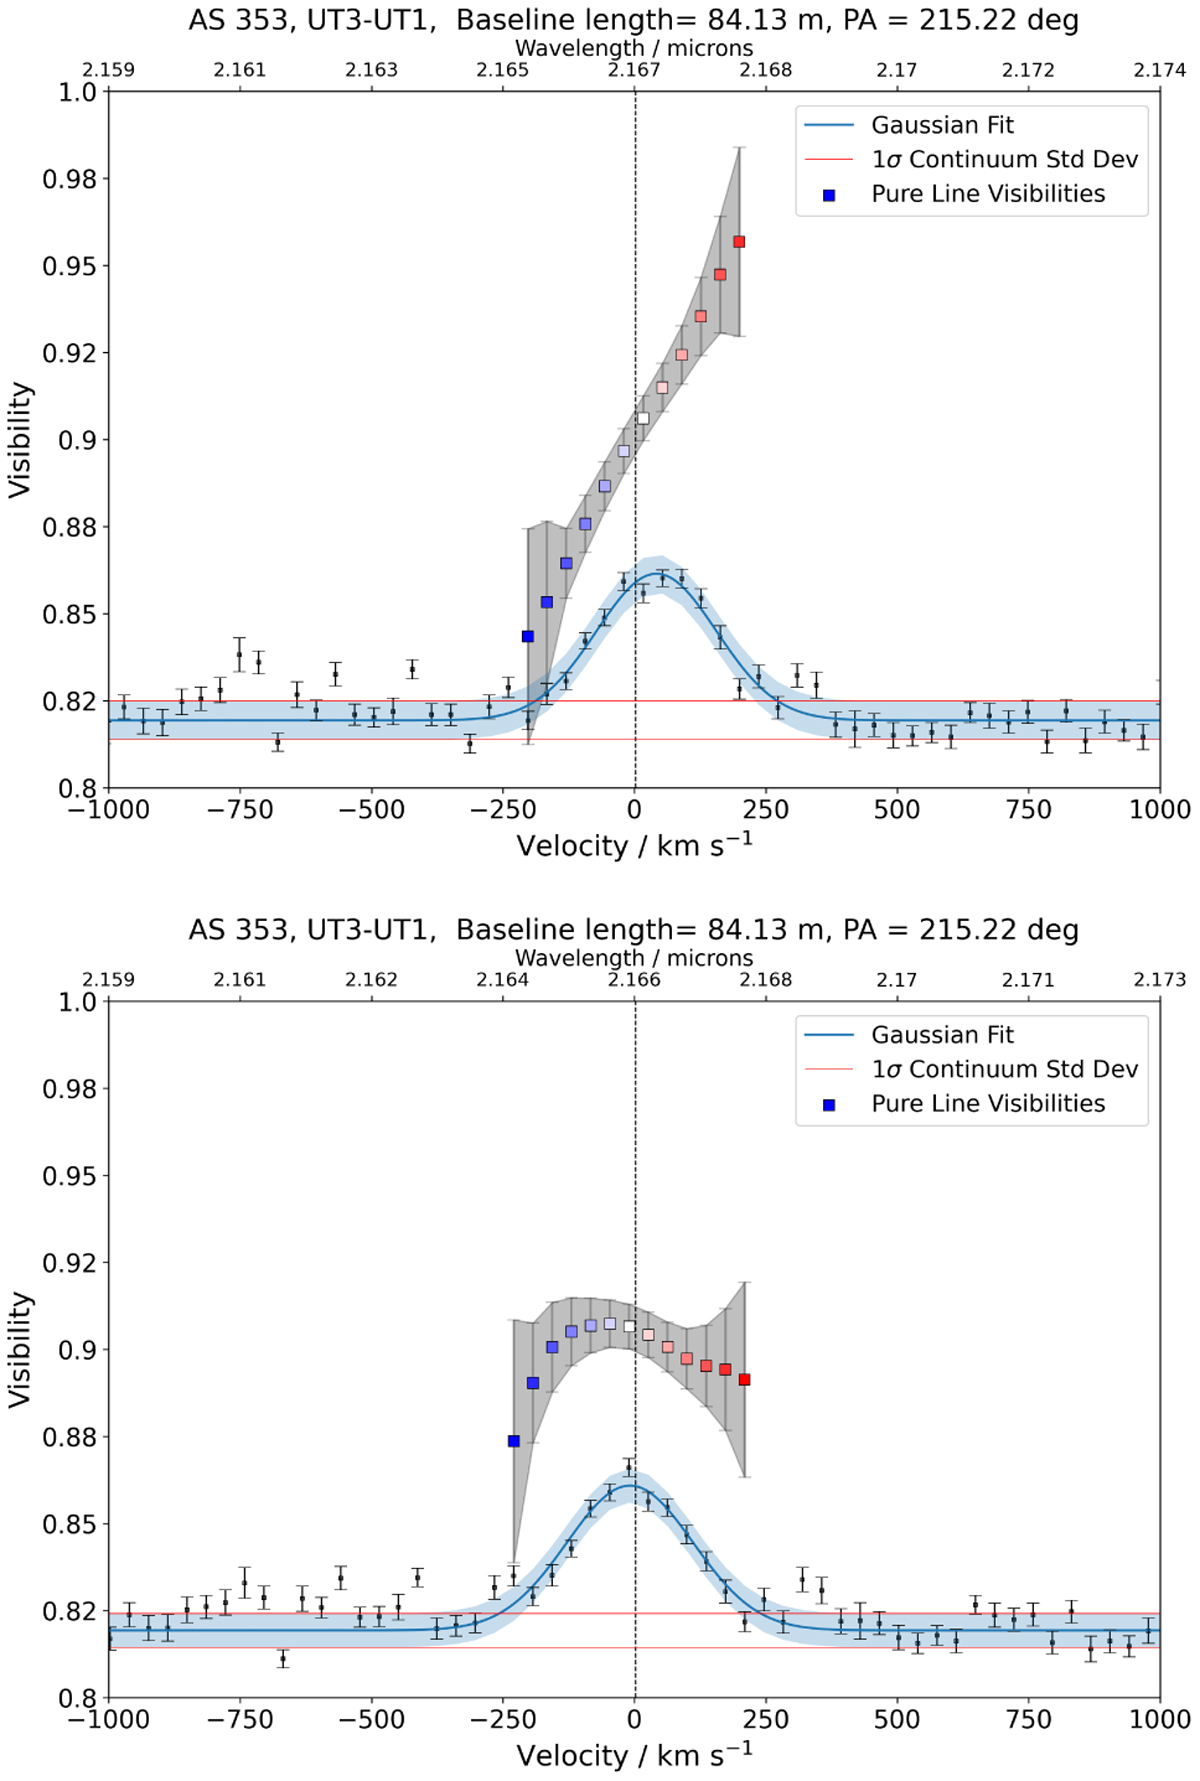
Total and pure line visibilities for an exemplary baseline from the AS 353 observation. Top: visibilities before the spectral correction was applied. Blue and grey shaded regions indicate the uncertainties on the total and pure line visibilities, respectively. Bottom: same baseline after the correction. Especially with respect to the computation of the pure line visibilities, the change appears significant in the red wing of the signal.
Current usage metrics show cumulative count of Article Views (full-text article views including HTML views, PDF and ePub downloads, according to the available data) and Abstracts Views on Vision4Press platform.
Data correspond to usage on the plateform after 2015. The current usage metrics is available 48-96 hours after online publication and is updated daily on week days.
Initial download of the metrics may take a while.