Fig. 4
Download original image
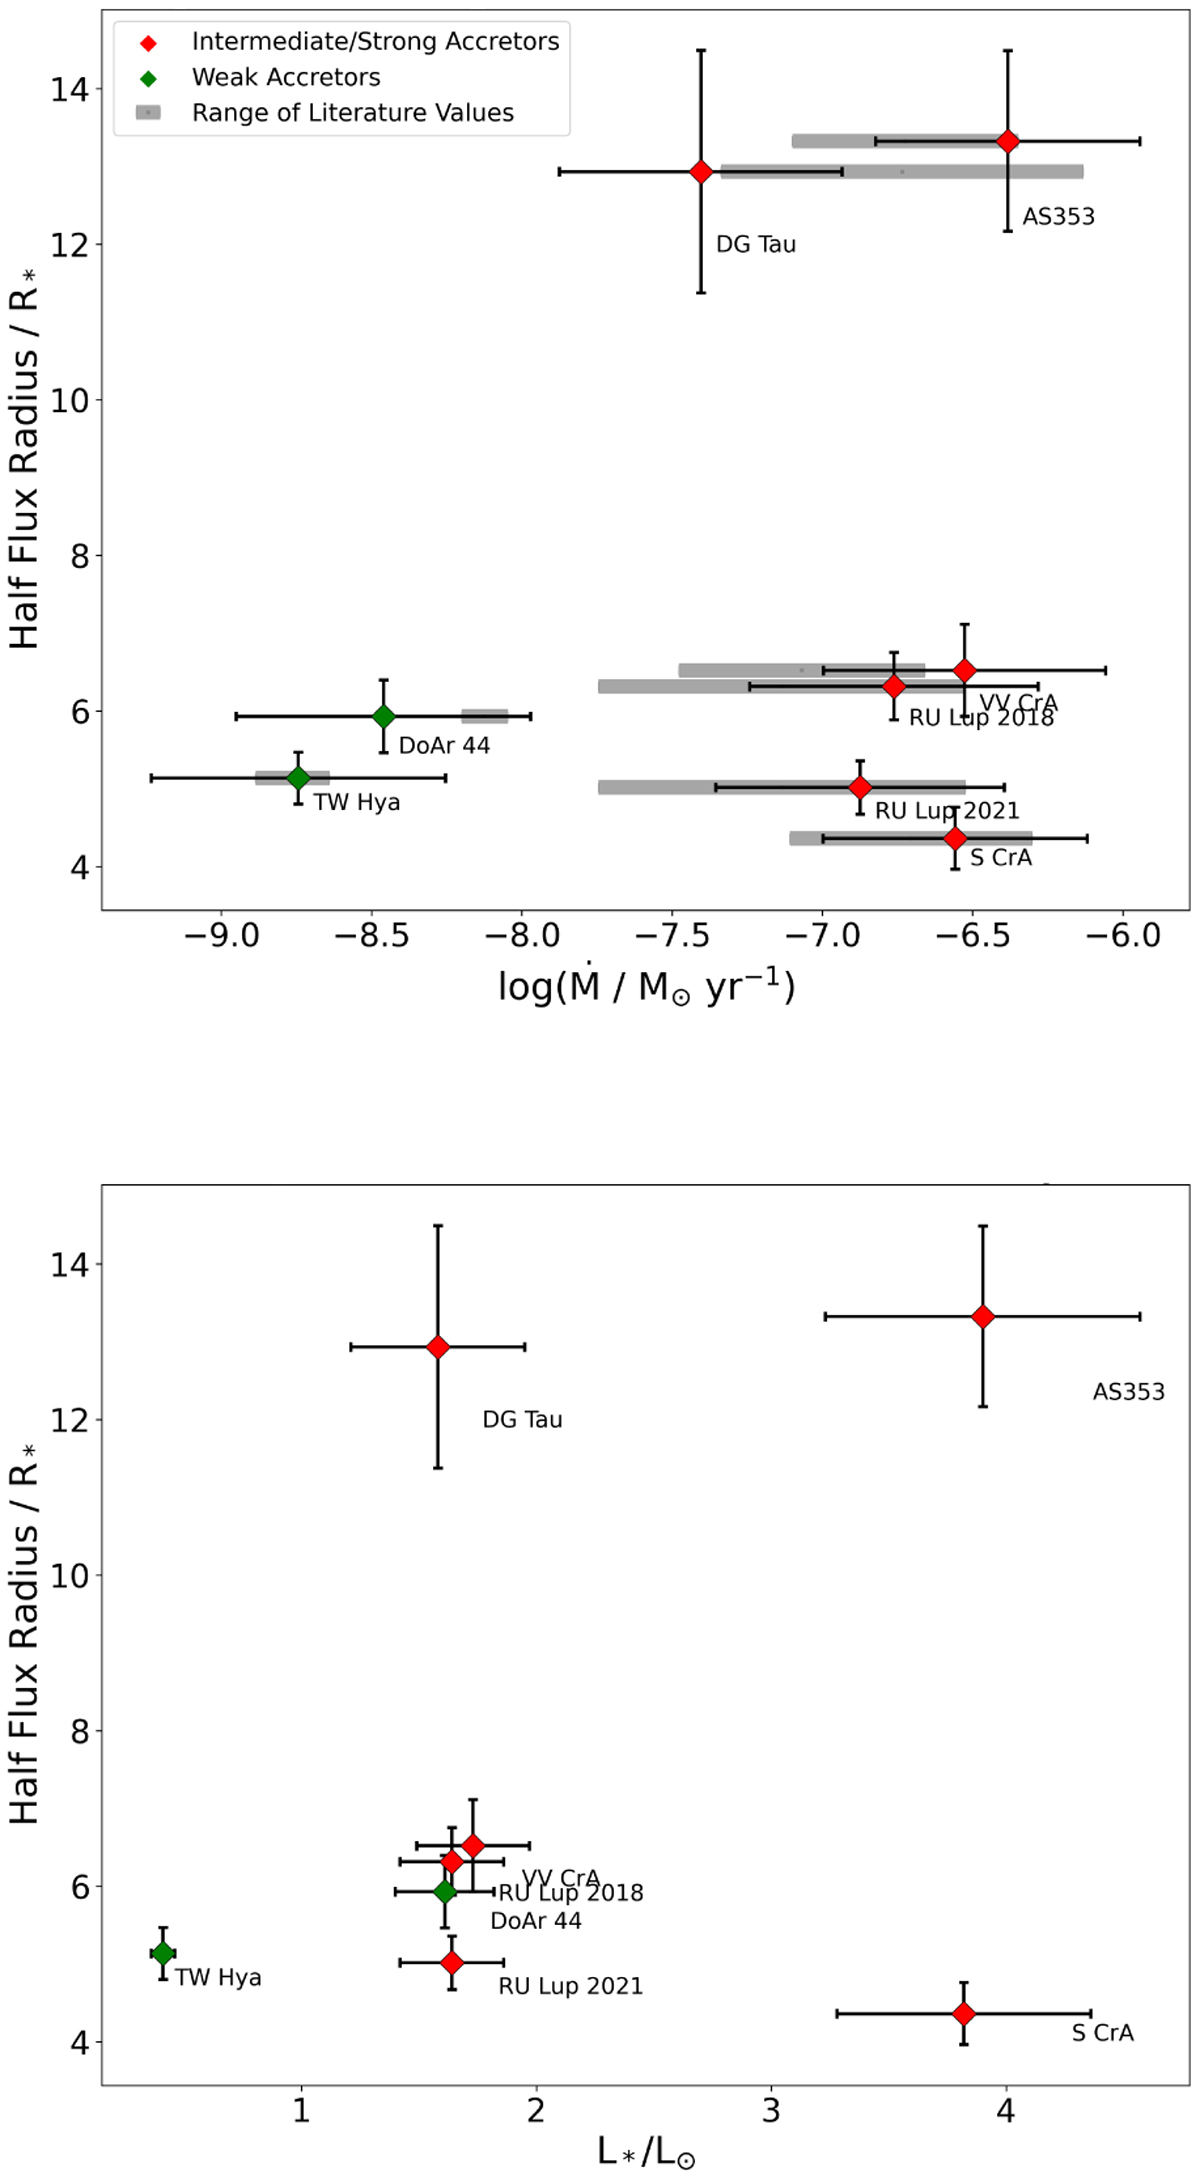
Relationships between Brγ emission region sizes and selected stellar properties. Top: fitted HWHM of the Brγ pure line emission region of the central channel versus the mass-accretion rate. The latter is depicted in two forms: once as a grey bar which denotes the range of ![]() values found in the literature on the respective source, then as the instantaneous mass-accretion rate, which was derived from the equivalent width of the GRAVITY Brγ spectra. The colour coding represents the classification of the sample objects as either weak (green) or intermediate to strong accretors (red). Most of the T Tauri stars cluster in a 4–7 R* range, which is of the order of typical magnetospheric sizes. Bottom: Brγ HWHM versus accretion luminosities. The colour coding corresponds to the upper plot.
values found in the literature on the respective source, then as the instantaneous mass-accretion rate, which was derived from the equivalent width of the GRAVITY Brγ spectra. The colour coding represents the classification of the sample objects as either weak (green) or intermediate to strong accretors (red). Most of the T Tauri stars cluster in a 4–7 R* range, which is of the order of typical magnetospheric sizes. Bottom: Brγ HWHM versus accretion luminosities. The colour coding corresponds to the upper plot.
Current usage metrics show cumulative count of Article Views (full-text article views including HTML views, PDF and ePub downloads, according to the available data) and Abstracts Views on Vision4Press platform.
Data correspond to usage on the plateform after 2015. The current usage metrics is available 48-96 hours after online publication and is updated daily on week days.
Initial download of the metrics may take a while.