Fig. 5
Download original image
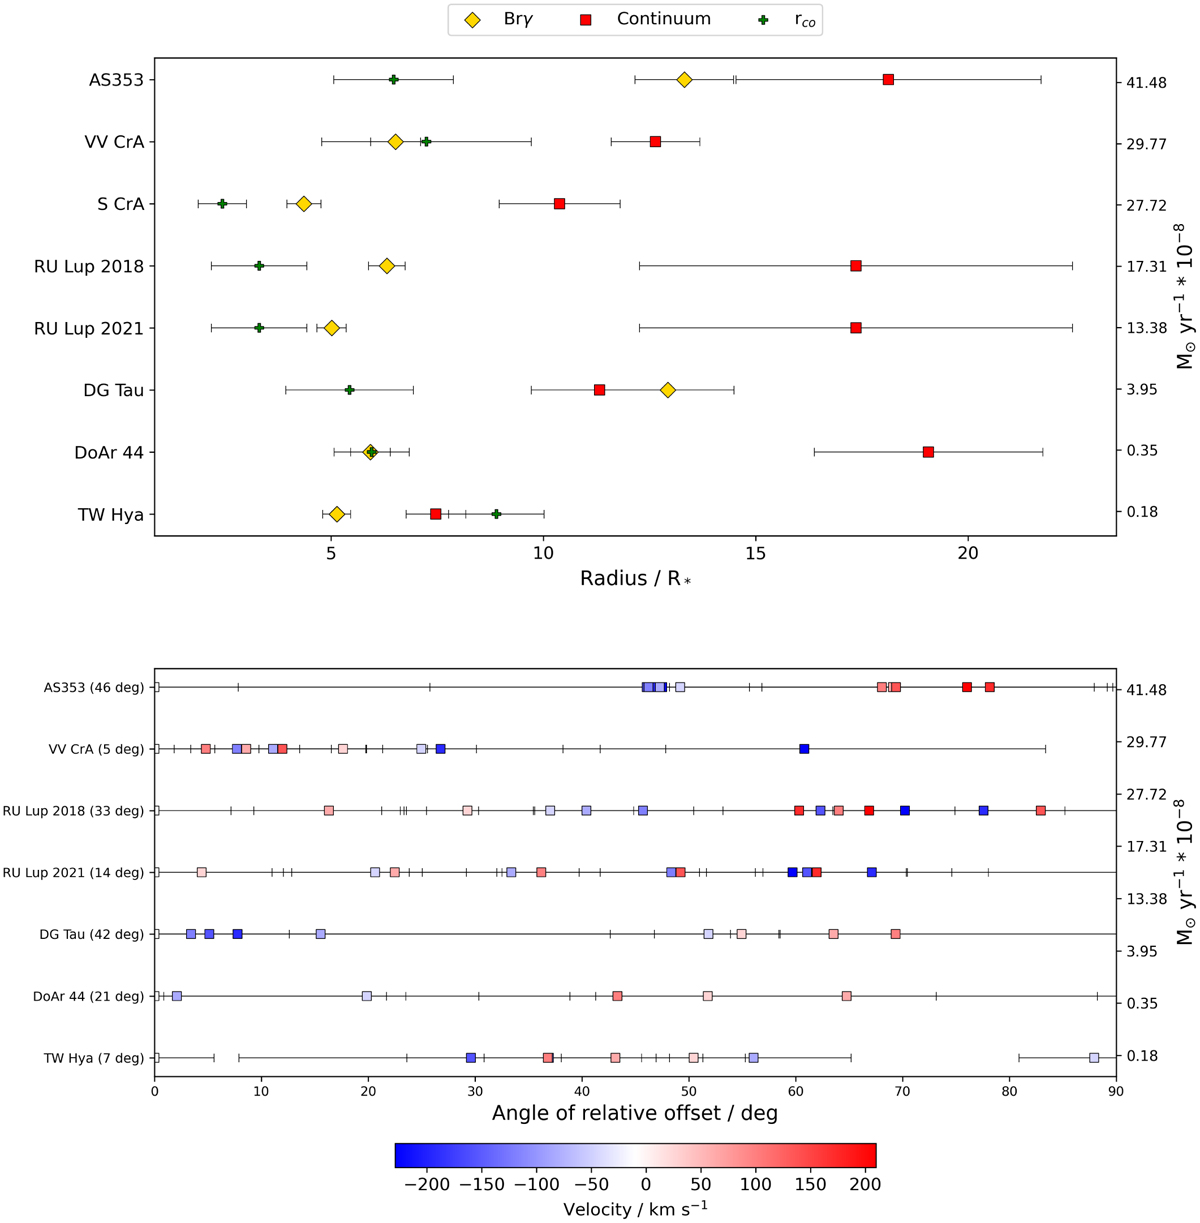
Sample overview for emission region sizes and photocenter shifts. Top: Brγ half-flux radii (yellow), compared to K-band NIR continuum half-flux radii (red) and co-rotation radii (green) across the sample. We note that Brγ region and continuum HWHMs are based on a Gaussian disk and a Gaussian ring model, respectively, which should approximately reflect the differences in the morphology of both regions. The objects are given in order of descending mass-accretion rate. Bottom: the distribution of photocentre shift angles across the line for the entire sample. The x-axis shows the minimum difference angle between the relative shift vector and the position angle of the continuum disk. The white channel serves as the point of reference for the relative shift vector. An angle of 0° means the photocentre shift vector is aligned with the disk axis, as would for example be expected for a disk in rotation. A difference angle of 90° indicates that the shift vector is perpendicular to the disk axis. A clustering of points close to a certain difference angle indicates an alignment of the photocentre shifts along a preferential axis. VV CrA shows a monoaxial distribution of photocentres, while for other targets more complex profiles with multiple alignments are indicated. The number stated in brackets after the object name gives the average error on the angle for the five central channels.
Current usage metrics show cumulative count of Article Views (full-text article views including HTML views, PDF and ePub downloads, according to the available data) and Abstracts Views on Vision4Press platform.
Data correspond to usage on the plateform after 2015. The current usage metrics is available 48-96 hours after online publication and is updated daily on week days.
Initial download of the metrics may take a while.