Fig. 9
Download original image
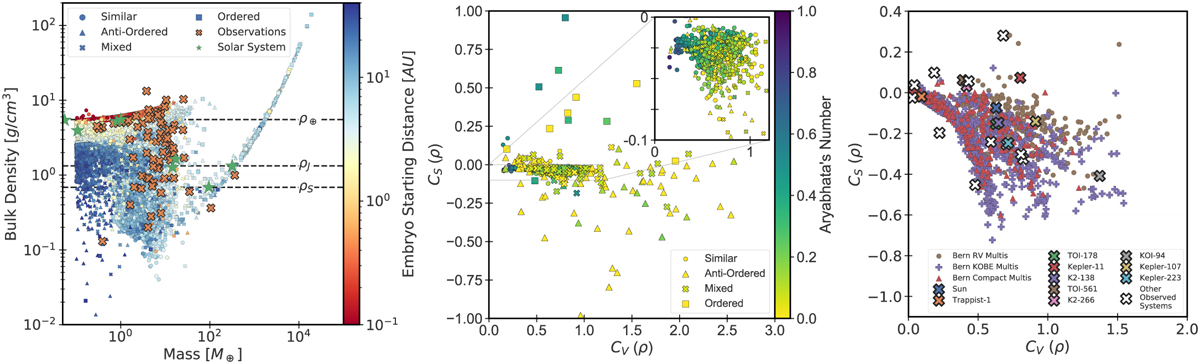
Density architecture. Left: bulk density of simulated and few observed planets as a function of their mass and starting locations (for synthetic planets). The marker indicates the mass architecture of the system to which a synthetic planet belongs to. Middle: density architecture, of synthetic planetary systems, as seen through the coefficient of similarity versus the coefficient of variation plot. The marker shape and colour indicates their host system mass architecture and the system’s Aryabhata’s number (see Paper II), respectively. Right: density architecture of planetary systems from the simulated observed catalogue and few observed planetary systems.
Current usage metrics show cumulative count of Article Views (full-text article views including HTML views, PDF and ePub downloads, according to the available data) and Abstracts Views on Vision4Press platform.
Data correspond to usage on the plateform after 2015. The current usage metrics is available 48-96 hours after online publication and is updated daily on week days.
Initial download of the metrics may take a while.