Open Access
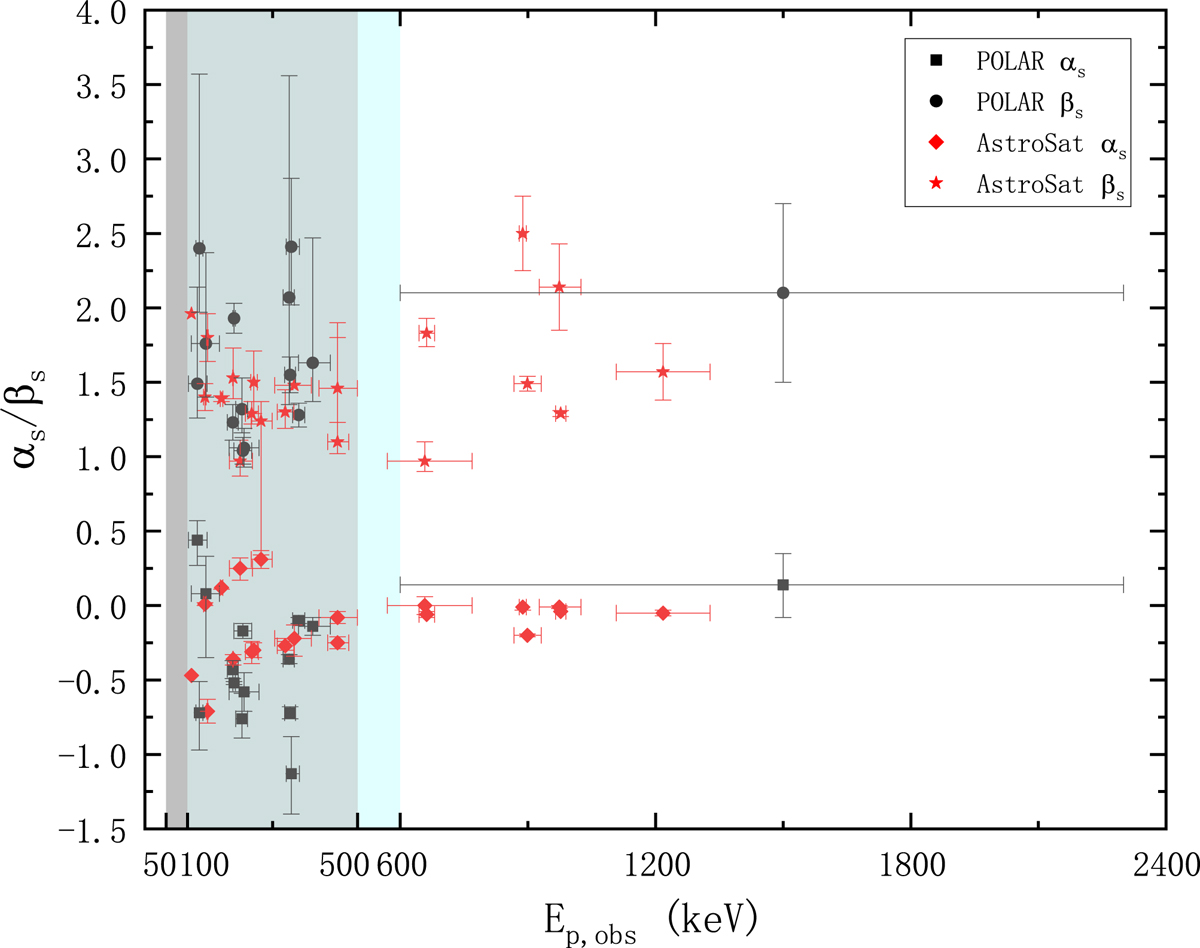
Fig. 4.
Download original image
Comparison of the spectral parameters of the bursts observed with POLAR and AstroSat. The black squares and circles represent low- and high-energy spectral indices for bursts detected by POLAR, the red diamonds and stars correspond to low- and high-energy spectral indices for bursts observed by AstroSat.
Current usage metrics show cumulative count of Article Views (full-text article views including HTML views, PDF and ePub downloads, according to the available data) and Abstracts Views on Vision4Press platform.
Data correspond to usage on the plateform after 2015. The current usage metrics is available 48-96 hours after online publication and is updated daily on week days.
Initial download of the metrics may take a while.