Fig. 12.
Download original image
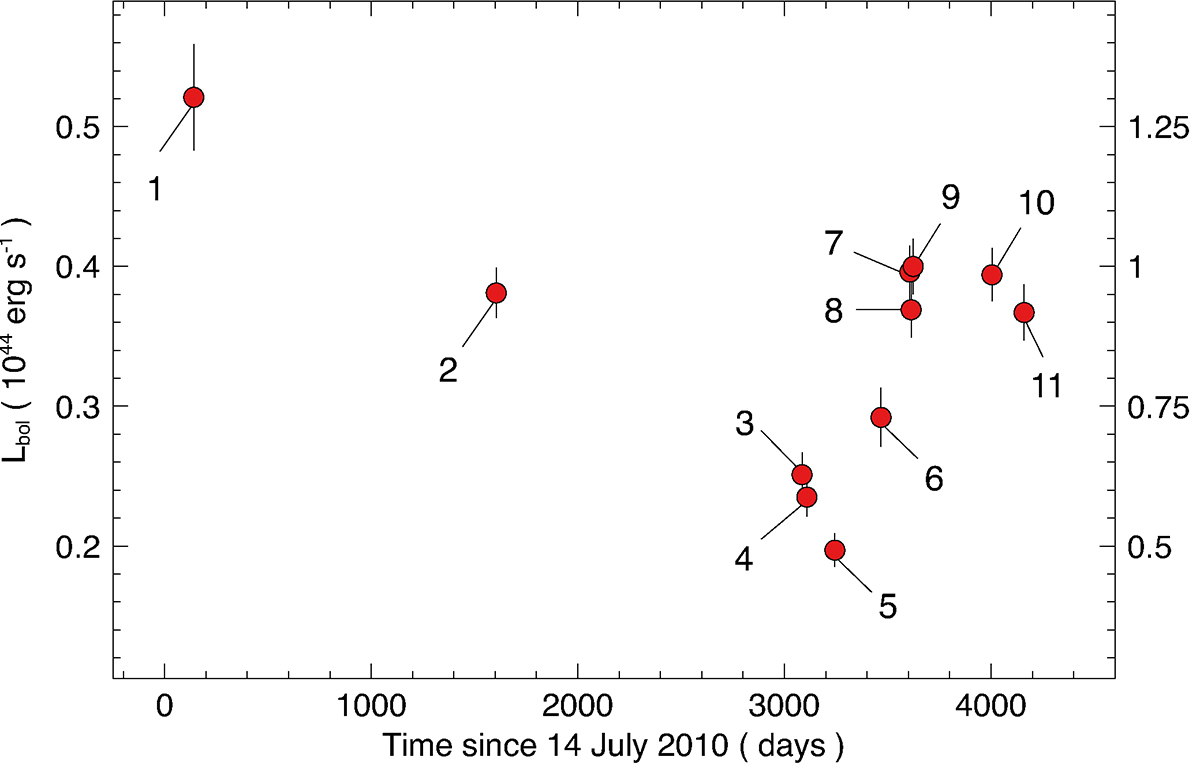
Bolometric luminosity evolution as inferred from OPTXAGNF best-fitting models to the 11 XMM-Newton observations. The left y-axis corresponds to the compact disc (Rout ≃ 15 Rg), and the right y-axis to the more extended one (Rout ≃ 140 Rg). The conversion between the two is a factor of ≃2.5. For each data point, we also show the corresponding XMM-Newton observation number (XMM1 to XMM11) as reference.
Current usage metrics show cumulative count of Article Views (full-text article views including HTML views, PDF and ePub downloads, according to the available data) and Abstracts Views on Vision4Press platform.
Data correspond to usage on the plateform after 2015. The current usage metrics is available 48-96 hours after online publication and is updated daily on week days.
Initial download of the metrics may take a while.