Fig. 13.
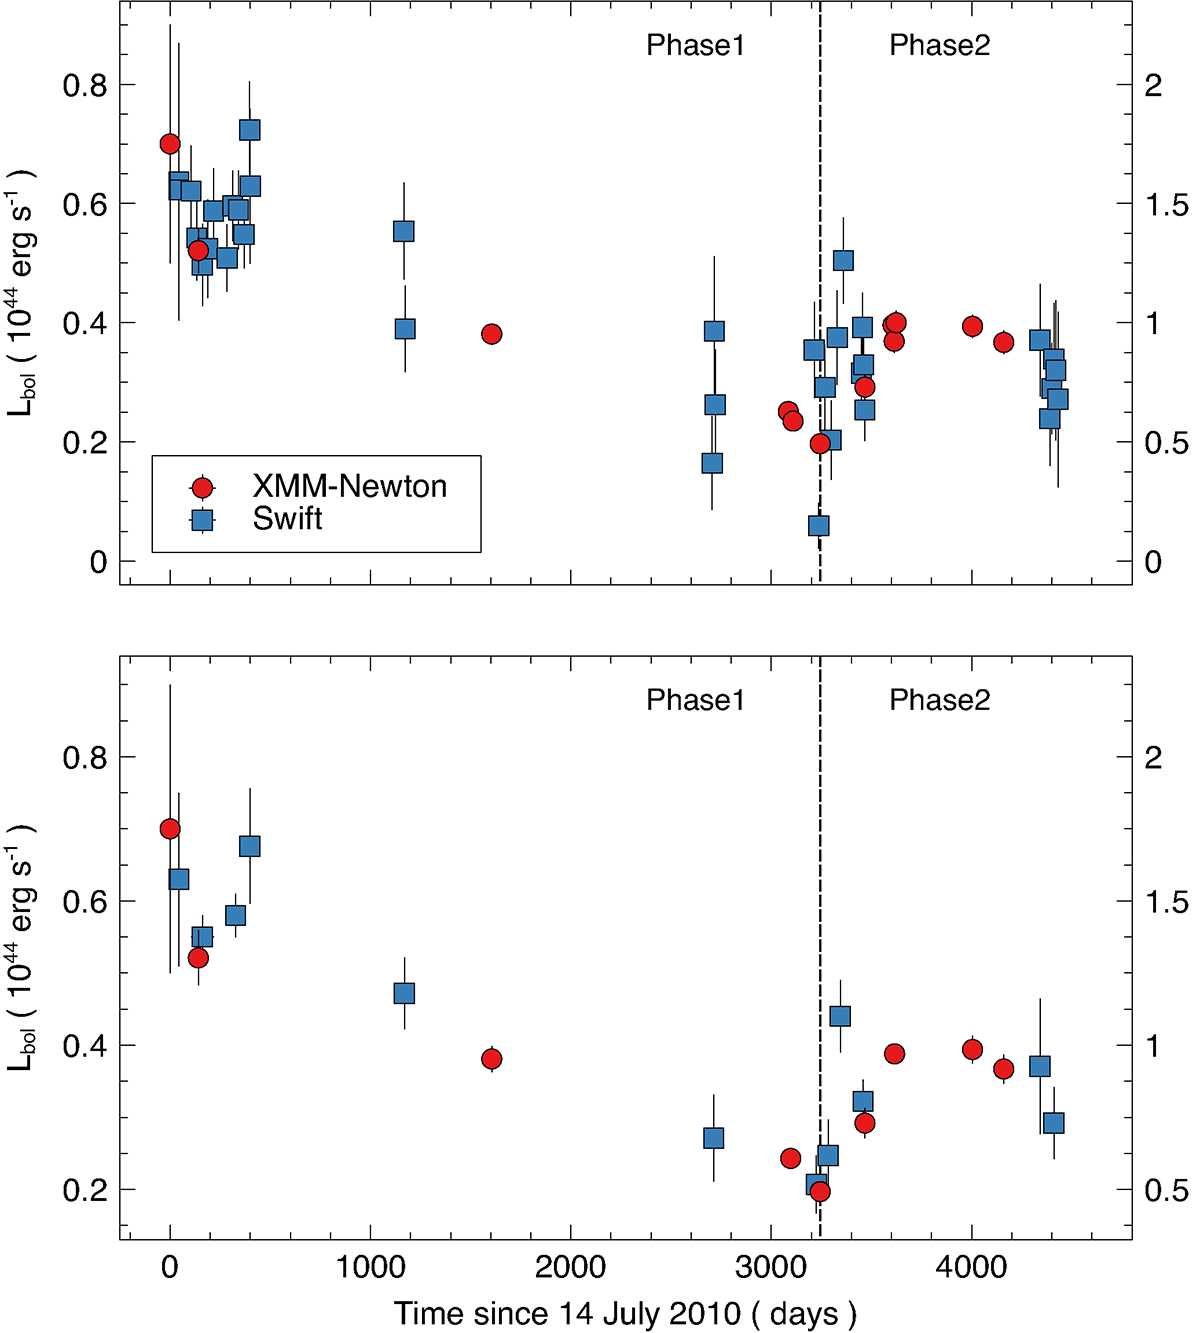
Download original image
Long-term evolution of the (quiescent level) bolometric luminosity. The y-axis scales have been defined in the caption of Fig. 12. In the upper panel we show the original light curve from all XMM-Newton and Swift observations. The lower panel shows a re-binned version of the same light curve (see text for details). In both panels, a vertical dashed line separates two different phases of the evolution: Phase1 comprises the initial X-ray peak and subsequent decay during the first ≃9 yr, while Phase2 is associated with the late-time X-ray re-brightening.
Current usage metrics show cumulative count of Article Views (full-text article views including HTML views, PDF and ePub downloads, according to the available data) and Abstracts Views on Vision4Press platform.
Data correspond to usage on the plateform after 2015. The current usage metrics is available 48-96 hours after online publication and is updated daily on week days.
Initial download of the metrics may take a while.