Open Access
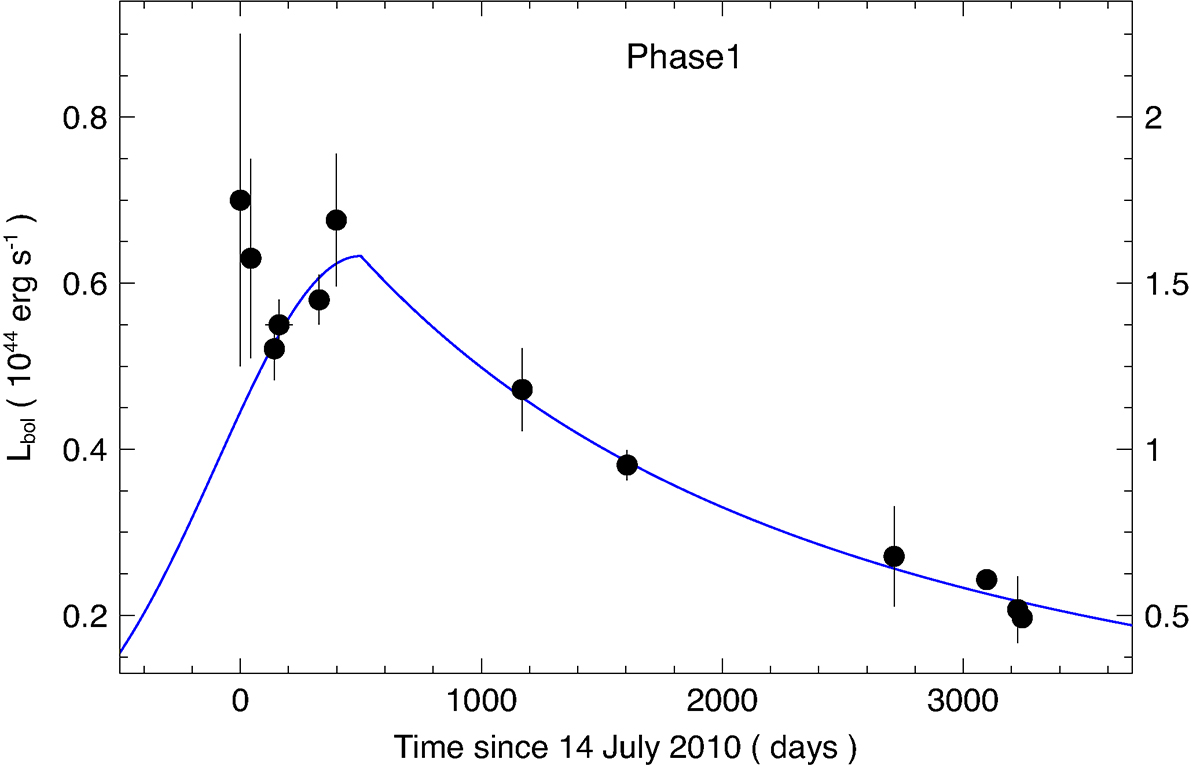
Fig. 14.
Download original image
Lbol light curve during Phase1. The y-axis scales have been defined in the caption of Fig. 12. We show a simple model comprising a Gaussian rise and a power law decay with t−9/4.
Current usage metrics show cumulative count of Article Views (full-text article views including HTML views, PDF and ePub downloads, according to the available data) and Abstracts Views on Vision4Press platform.
Data correspond to usage on the plateform after 2015. The current usage metrics is available 48-96 hours after online publication and is updated daily on week days.
Initial download of the metrics may take a while.