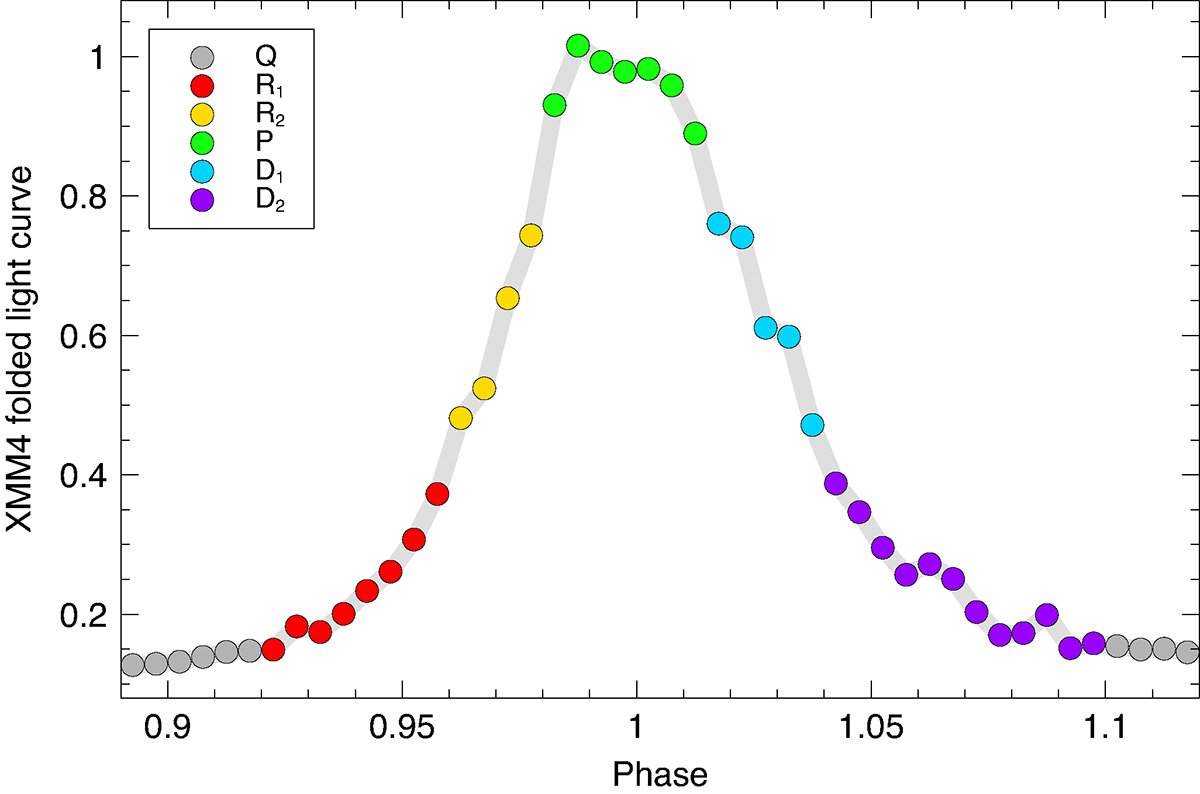
Fig. 17.
Download original image
XMM4 folded light curve (at the average recurrence time between QPEs). The light curve is normalised to the peak amplitude and shifted so that the peak is at phase 1. We show with different colours the phase intervals used to accumulate the spectra during the rise (R1 and R2), peak (P), and decay (D1 and D2). The quiescent spectrum (Q) is accumulated throughout the exposure (excluding time-intervals when QPE are present) and only a small fraction of the corresponding phase-interval is shown here. A phase interval Δp = 0.05 corresponds to a time interval Δt ≃ 1.6 ks.
Current usage metrics show cumulative count of Article Views (full-text article views including HTML views, PDF and ePub downloads, according to the available data) and Abstracts Views on Vision4Press platform.
Data correspond to usage on the plateform after 2015. The current usage metrics is available 48-96 hours after online publication and is updated daily on week days.
Initial download of the metrics may take a while.