Fig. 18.
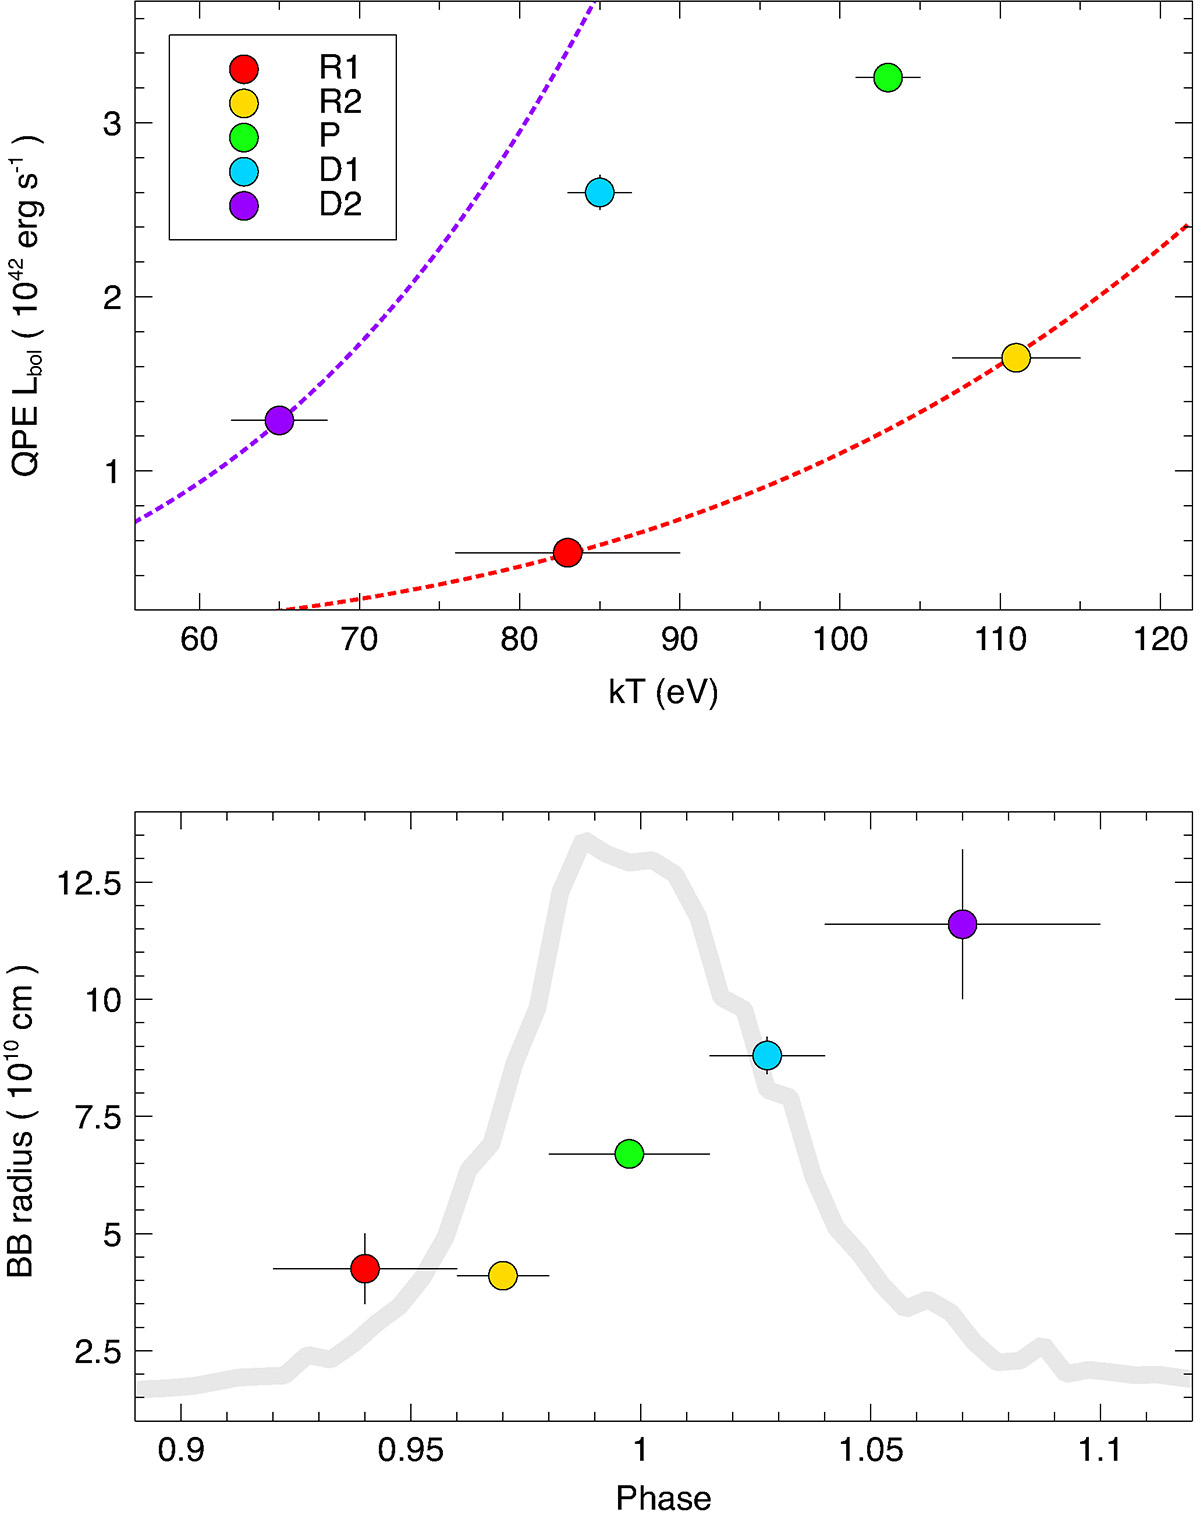
Download original image
QPE spectral evolution during XMM4. In the upper panel we show Lbol as a function of blackbody rest-frame temperature. The colour-code is that defined in Fig. 17. The evolution starts at R1 (lowest Lbol at ≃83 eV, red data point) and proceeds counter-clockwise. The two dotted lines are Lbol ∝ T4 relations normalised to the extremal of the QPE evolution (R1 and D2). The lower panel shows the estimated radius of the blackbody emitting region as a function of QPE phase. The re-scaled QPE profile is also shown for reference (light grey).
Current usage metrics show cumulative count of Article Views (full-text article views including HTML views, PDF and ePub downloads, according to the available data) and Abstracts Views on Vision4Press platform.
Data correspond to usage on the plateform after 2015. The current usage metrics is available 48-96 hours after online publication and is updated daily on week days.
Initial download of the metrics may take a while.