Fig. 19.
Download original image
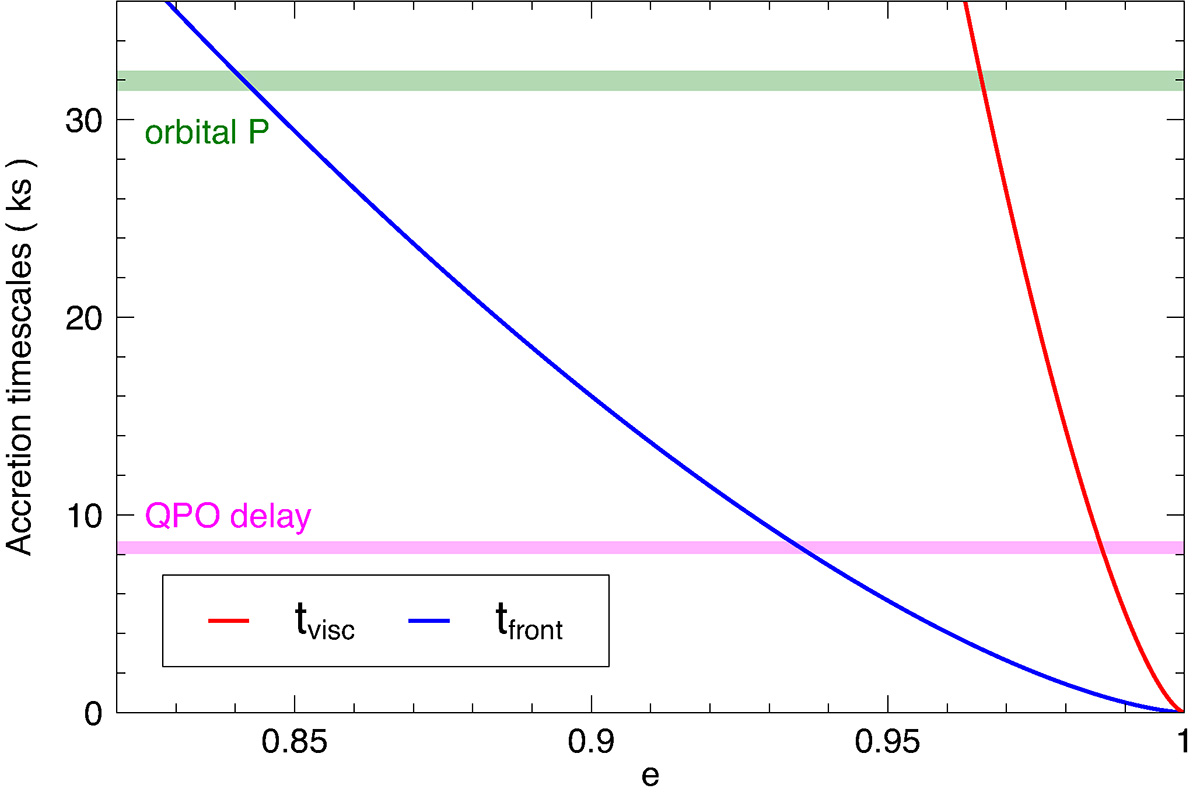
Viscous and front propagation timescales tvisc and tfront evaluated at Rsh as a function of orbital eccentricity. The upper (green) horizontal shaded area represents the period of the shock-induced perturbation (equal to that of the QPE or QPO, i.e. to the orbital period in the assumed scenario), while the lower (magenta) one is the shortest observed time delay of the QPO with respect to the immediately preceding QPE (XMM3).
Current usage metrics show cumulative count of Article Views (full-text article views including HTML views, PDF and ePub downloads, according to the available data) and Abstracts Views on Vision4Press platform.
Data correspond to usage on the plateform after 2015. The current usage metrics is available 48-96 hours after online publication and is updated daily on week days.
Initial download of the metrics may take a while.