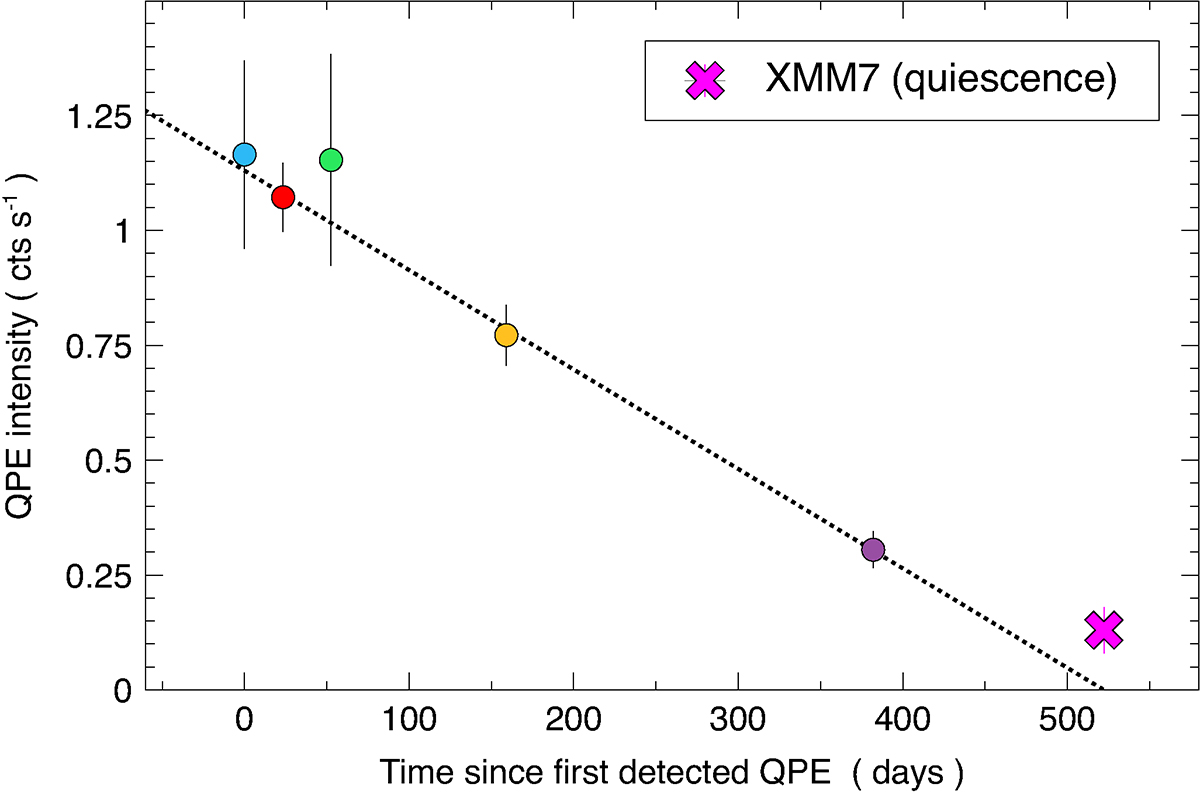
Fig. 2.
Download original image
Time evolution of the QPE intensity since first detection. The QPE intensity is measured as the average of the best-fitting Gaussian normalisation in each observation (i.e. we ignore here the difference between strong and weak QPEs). The colour scheme is the same as in Fig. 1. The dotted line represents the best-fitting linear relation (corresponding to a decay of about 0.22 cts s−1 per 100 d). We also show (cross) the continuum level during the first observation with no detected QPEs (XMM7).
Current usage metrics show cumulative count of Article Views (full-text article views including HTML views, PDF and ePub downloads, according to the available data) and Abstracts Views on Vision4Press platform.
Data correspond to usage on the plateform after 2015. The current usage metrics is available 48-96 hours after online publication and is updated daily on week days.
Initial download of the metrics may take a while.