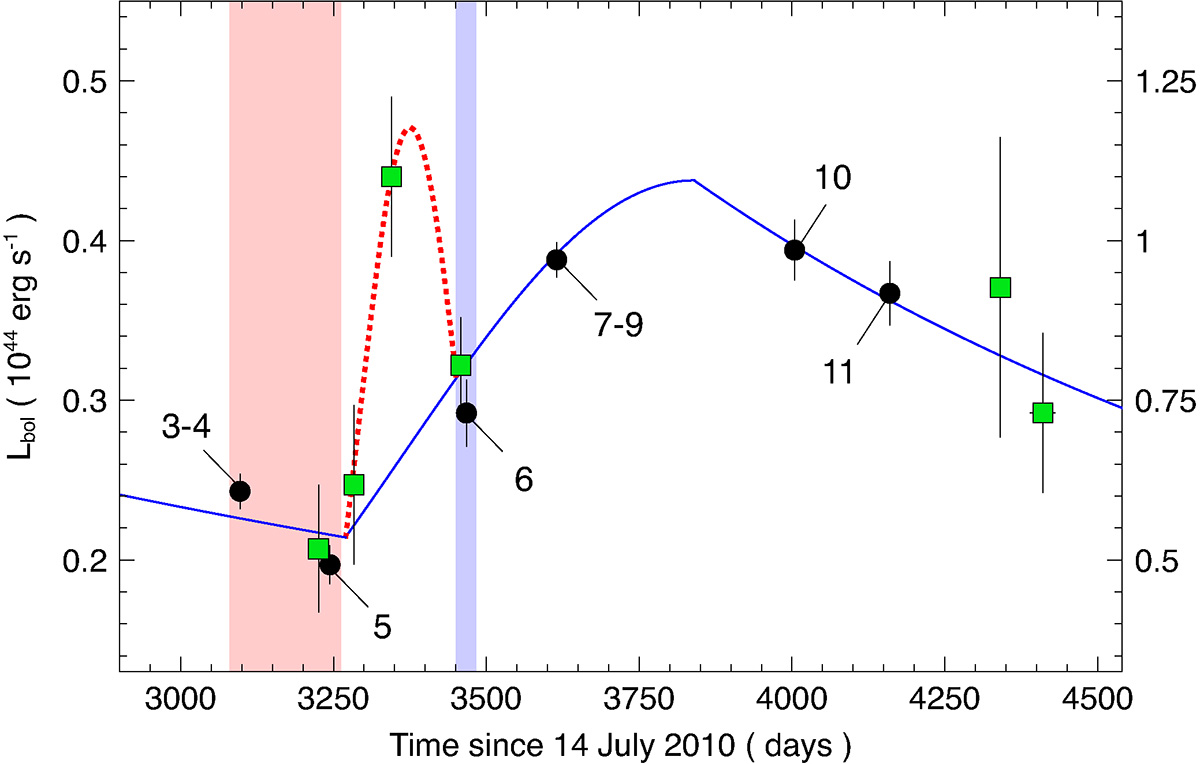
Fig. 21.
Download original image
Portion of the Lbol light curve comprising the final part of TDE 1 and the overall TDE 2 evolution. Black circles (green squares) denote XMM-Newton (Swift) observations. Only XMM-Newton observations (whose observation number is also indicated) are long enough to detect QPEs. The shaded area highlight time-intervals during which high-amplitude, regular QPE are detected (XMM3 to XMM5, red) and those in which weak QPEs with irregular recurrence times are observed (XMM6, blue). No QPEs are detected after XMM6, although the higher level of the quiescent emission might have decreased significantly their contrast in subsequent observations.
Current usage metrics show cumulative count of Article Views (full-text article views including HTML views, PDF and ePub downloads, according to the available data) and Abstracts Views on Vision4Press platform.
Data correspond to usage on the plateform after 2015. The current usage metrics is available 48-96 hours after online publication and is updated daily on week days.
Initial download of the metrics may take a while.