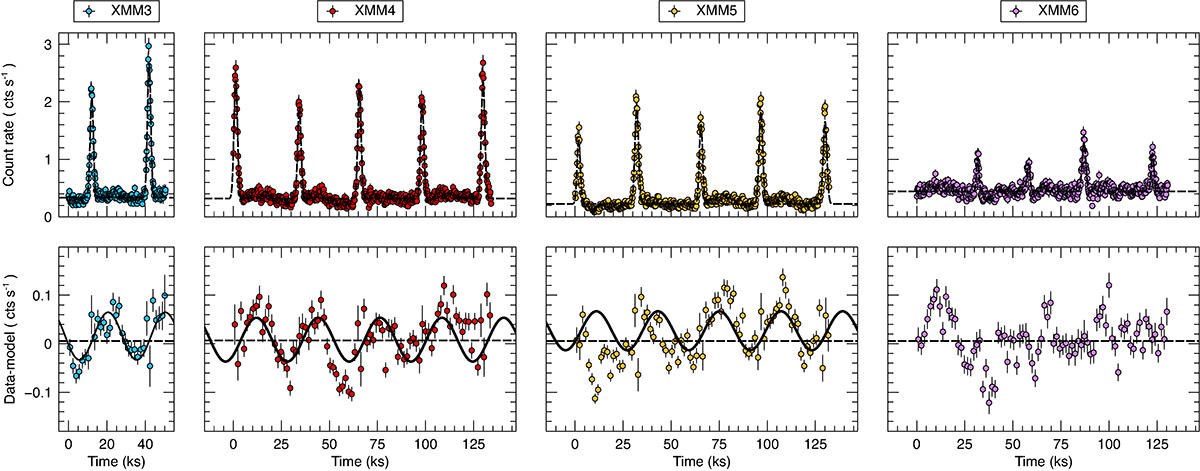
Fig. B.1.
Download original image
Quiescent level variability. In the upper panels, we show the 0.2-1 keV light curves from all XMM-Newton observations with QPEs, together with their best-fitting models comprising a constant and a series of Gaussian functions to describe the quiescent level and QPEs respectively. The lower panels show the corresponding residual light curves re-binned by a factor of 8, together with two models, a constant (dashed lines) and a sine function (solid lines) with a period equal to the average observation-dependent recurrence time.
Current usage metrics show cumulative count of Article Views (full-text article views including HTML views, PDF and ePub downloads, according to the available data) and Abstracts Views on Vision4Press platform.
Data correspond to usage on the plateform after 2015. The current usage metrics is available 48-96 hours after online publication and is updated daily on week days.
Initial download of the metrics may take a while.