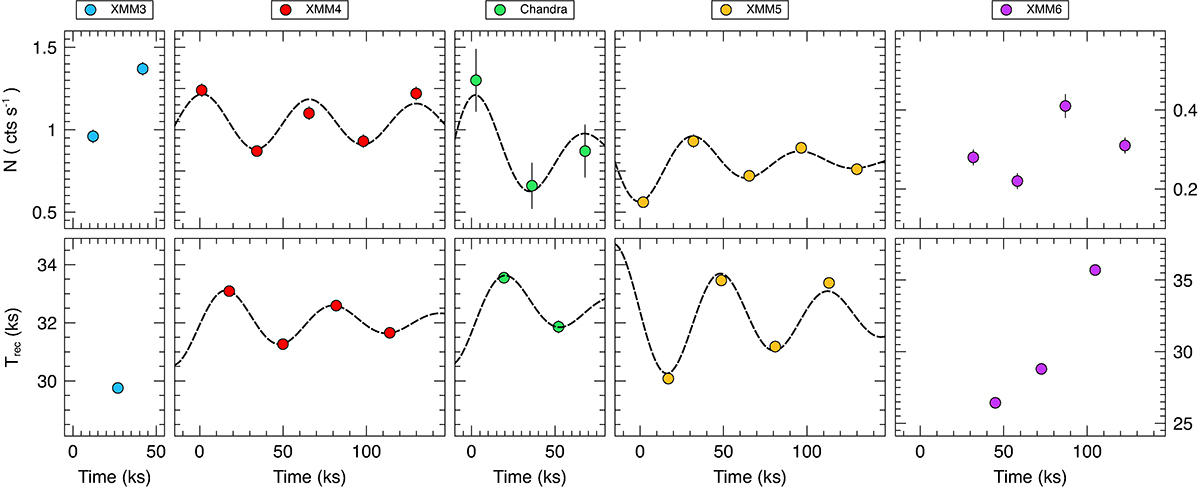
Fig. 3.
Download original image
Alternating QPE intensities and recurrence times. The QPE intensity (N) for all observations with QPEs is shown in the upper panels. The recurrence time between consecutive QPEs is shown in the lower panels (each data point is placed at a time corresponding to half the separation between consecutive QPEs). The y-axis is always in the same range, except for the irregular XMM6 observation. Dashed lines in the XMM4, Chandra, and XMM5 panels are sine functions with period equal to twice the averaged, observation-dependent recurrence time, and with an exponentially decaying amplitude that most likely indicates a common long-term modulation. The lines are intended to guide the eye rather than to provide fits to the data.
Current usage metrics show cumulative count of Article Views (full-text article views including HTML views, PDF and ePub downloads, according to the available data) and Abstracts Views on Vision4Press platform.
Data correspond to usage on the plateform after 2015. The current usage metrics is available 48-96 hours after online publication and is updated daily on week days.
Initial download of the metrics may take a while.