Fig. 4.
Download original image
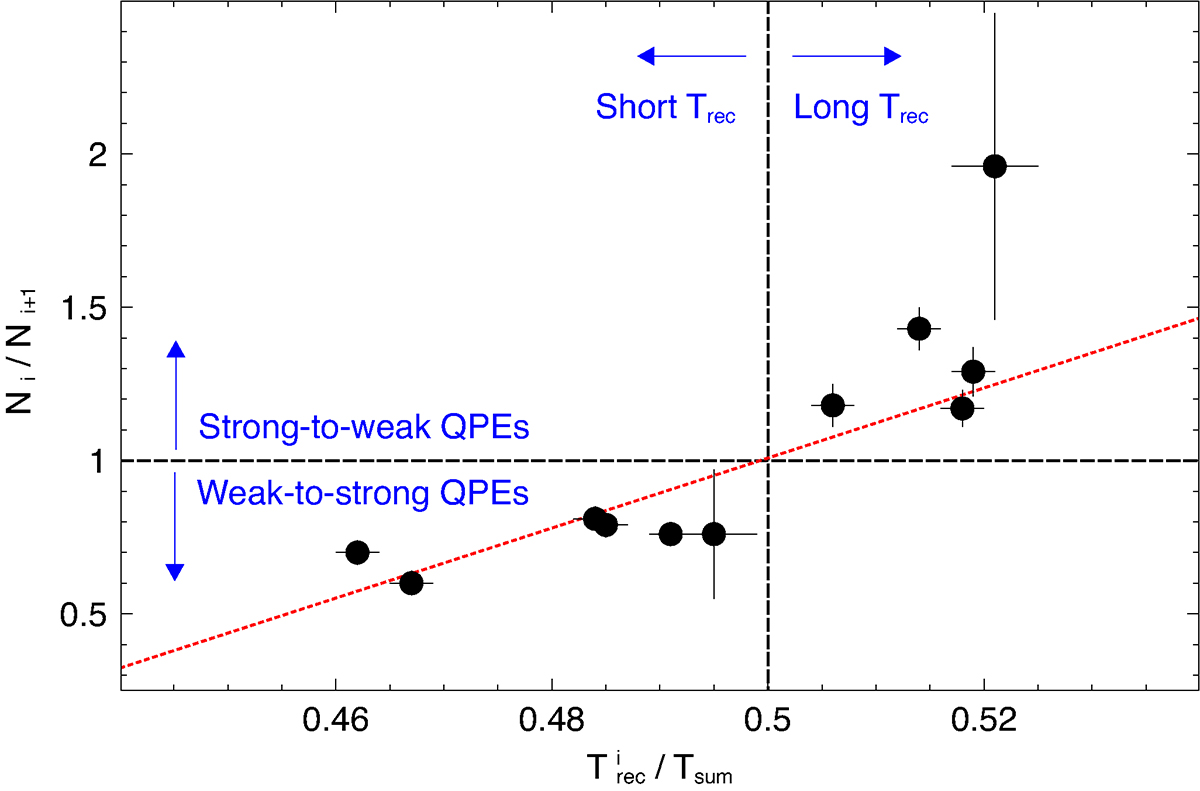
Consecutive QPEs intensity ratio and recurrence time correlation. The ratio between the intensity of consecutive QPEs is shown as a function of the recurrence time between them (normalised to the sum of consecutive long and short intervals Tsum). The horizontal line (Ni /Ni + 1 = 1) separates events where strong QPEs precede weak ones (upper half of the figure), from those where weak QPEs precede strong ones (lower half). The ![]() vertical line separates short from long recurrence times. The (red) dotted line show the best-fitting linear relation between the two quantities.
vertical line separates short from long recurrence times. The (red) dotted line show the best-fitting linear relation between the two quantities.
Current usage metrics show cumulative count of Article Views (full-text article views including HTML views, PDF and ePub downloads, according to the available data) and Abstracts Views on Vision4Press platform.
Data correspond to usage on the plateform after 2015. The current usage metrics is available 48-96 hours after online publication and is updated daily on week days.
Initial download of the metrics may take a while.