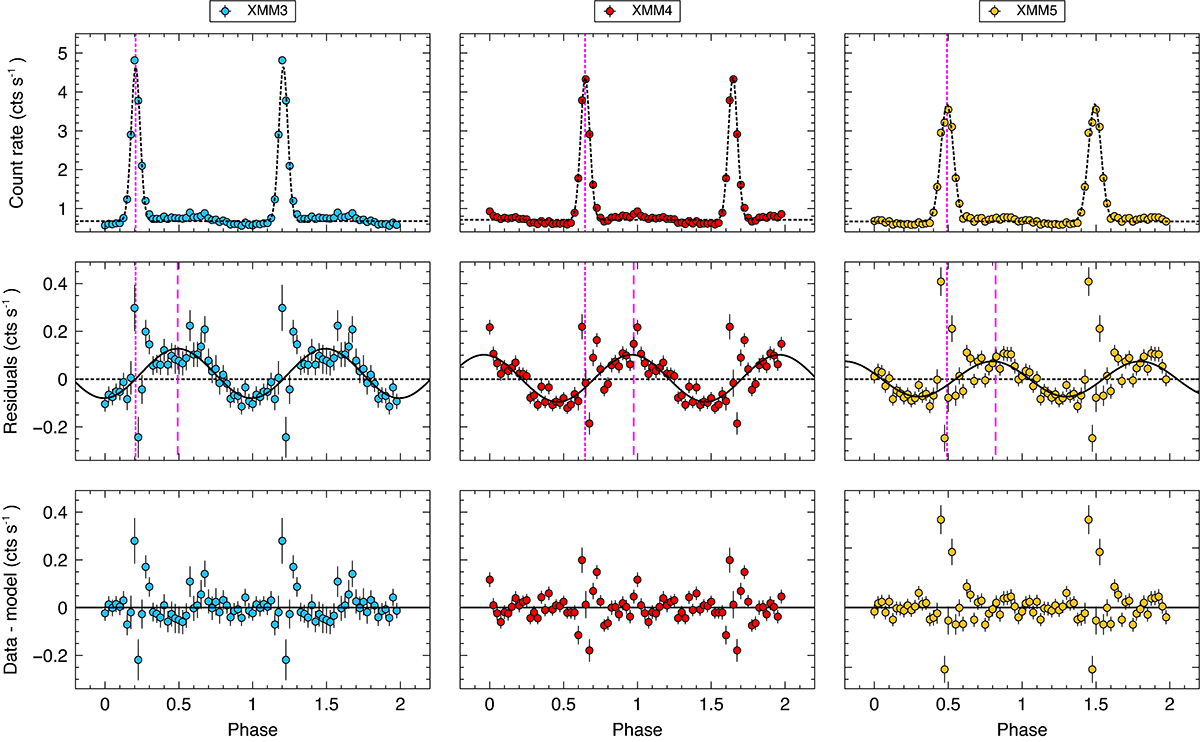
Fig. 5.
Download original image
Quasi-periodic oscillation of the quiescent level. In the upper panels, we show the 0.2–1 keV light curves from the XMM3, XMM4, and XMM5 folded at the average observation-dependent recurrence time, and the corresponding best-fitting baseline model (constant plus Gaussian functions, dotted). We show the 0–2 phase interval for visual clarity. In the middle panels, we show the resulting residual light curves together with a sine function with period fixed to 1 (in phase space) to guide the eye. The vertical lines represent the phase of the primary QPE (dotted) and of the peak of the sine function (dashed). In the lower panel, we show the residual for a fit of the original folded light curve that comprises a sine function with period fixed to 1 (i.e. to the folding timescale) in addition to the baseline model.
Current usage metrics show cumulative count of Article Views (full-text article views including HTML views, PDF and ePub downloads, according to the available data) and Abstracts Views on Vision4Press platform.
Data correspond to usage on the plateform after 2015. The current usage metrics is available 48-96 hours after online publication and is updated daily on week days.
Initial download of the metrics may take a while.