Open Access
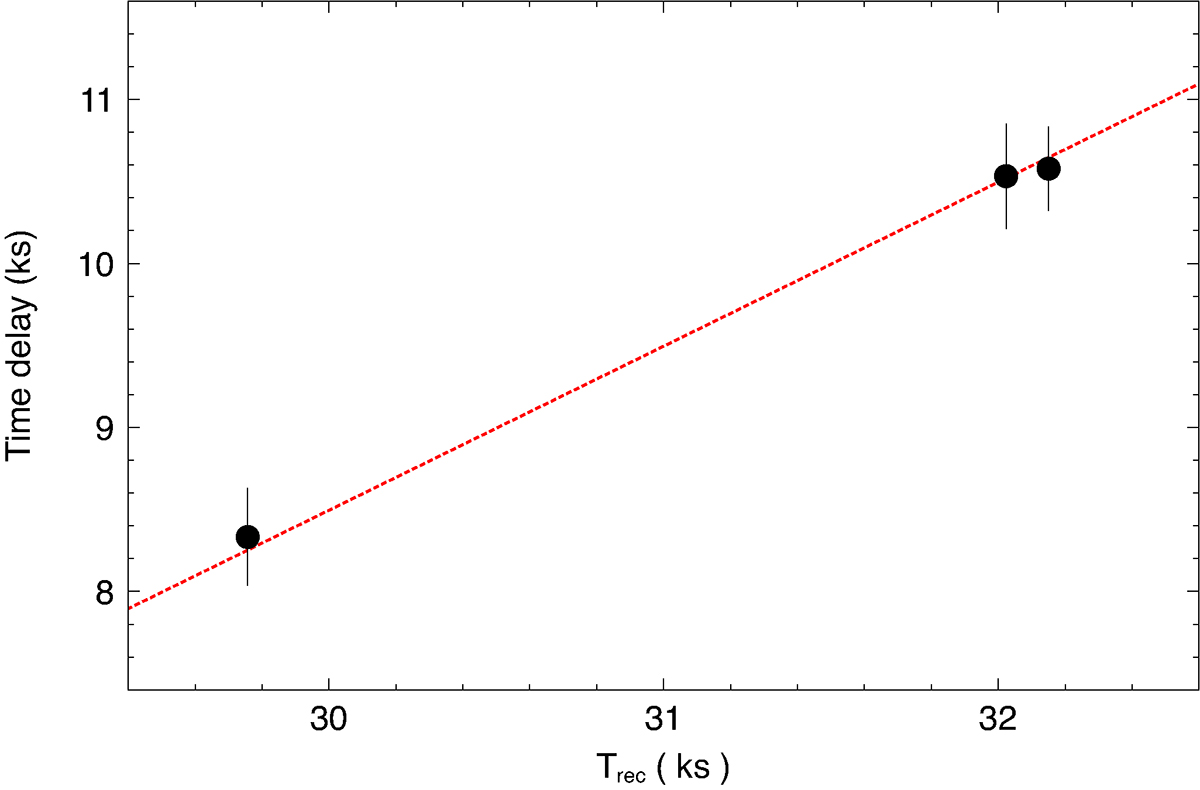
Fig. 7.
Download original image
QPE-QPO time delay. We show the time delay of the QPO peak with respect to the preceding QPE as a function of the average observation-dependent recurrence time. The dotted line is a linear function with slope fixed to 1, the best-fitting one being 0.95 ± 0.15.
Current usage metrics show cumulative count of Article Views (full-text article views including HTML views, PDF and ePub downloads, according to the available data) and Abstracts Views on Vision4Press platform.
Data correspond to usage on the plateform after 2015. The current usage metrics is available 48-96 hours after online publication and is updated daily on week days.
Initial download of the metrics may take a while.