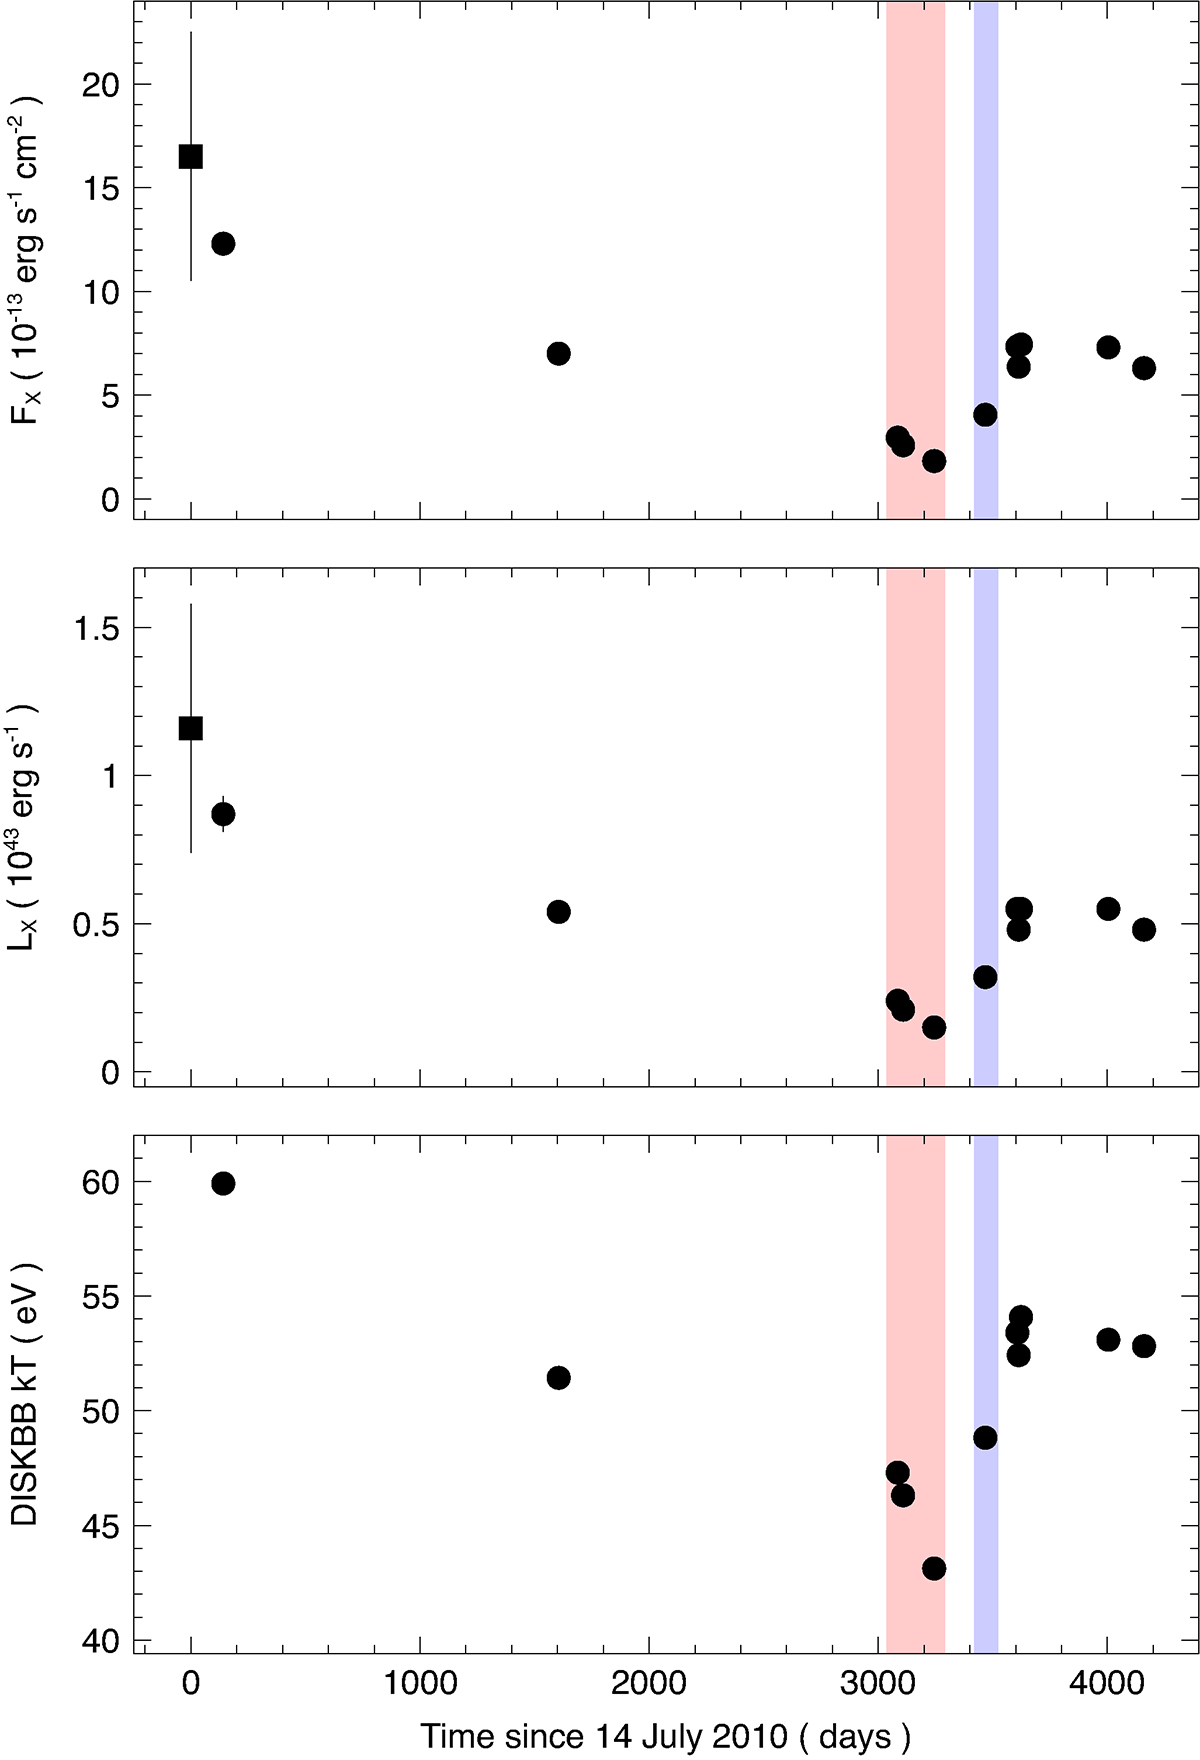
Fig. 9.
Download original image
X-ray flux, luminosity, and temperature evolution. From upper to lower panel, we show the observed 0.3–1 keV X-ray flux, the 0.3–1 keV intrinsic X-ray luminosity, and the (rest-frame) disc temperature evolution, as derived from our best-fitting DISKBB models to the 11 XMM-Newton pointed observations. The first data point in the upper and middle panels refers to the slew observation whose observed count rate has been converted into X-ray flux and luminosity by using the best-fitting model from the nearest XMM-Newton pointed observation (XMM1). In all panels, the shaded areas highlights the period during which regular (red, XMM3 to XMM5) and irregular (blue, XMM6) QPEs are detected.
Current usage metrics show cumulative count of Article Views (full-text article views including HTML views, PDF and ePub downloads, according to the available data) and Abstracts Views on Vision4Press platform.
Data correspond to usage on the plateform after 2015. The current usage metrics is available 48-96 hours after online publication and is updated daily on week days.
Initial download of the metrics may take a while.