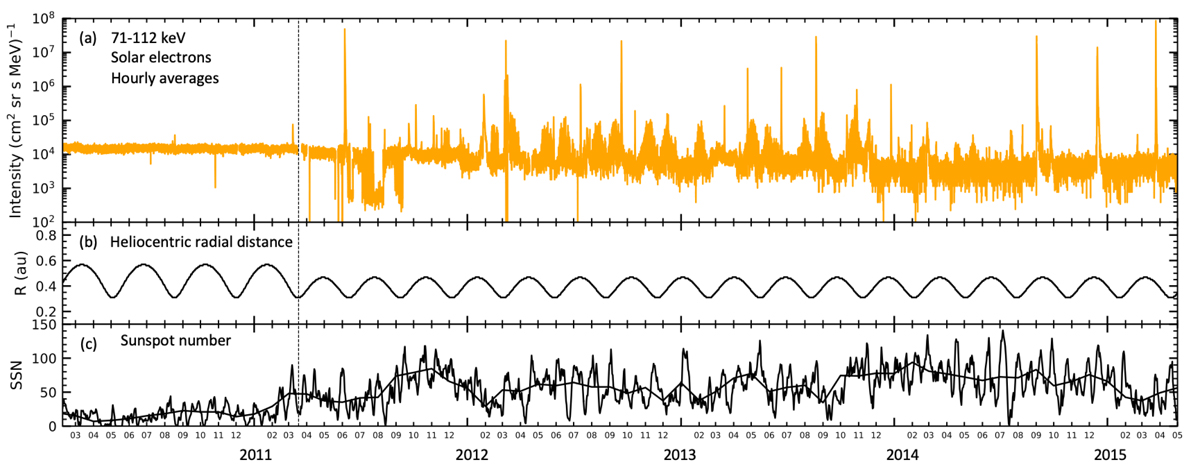
Fig. 1.
Download original image
MESSENGER/EPS data set used for the study. (a) Hourly averages of 71–112 keV electron intensities measured by MESSENGER/EPS. The time interval covers 2010 February 7 to 2015 May 1, where SEE events appear as vertical spikes. The vertical dashed line indicates the time when MESSENGER was injected in the orbit of Mercury. (b) Heliocentric distance of the MESSENGER mission during the time of analysis. (c) Daily and monthly (smooth line) averages of the sunspot number given by the American Relative Sunspot Number (https://www.ngdc.noaa.gov/stp/space-weather/solar-data/solar-indices/sunspot-numbers/american/lists/).
Current usage metrics show cumulative count of Article Views (full-text article views including HTML views, PDF and ePub downloads, according to the available data) and Abstracts Views on Vision4Press platform.
Data correspond to usage on the plateform after 2015. The current usage metrics is available 48-96 hours after online publication and is updated daily on week days.
Initial download of the metrics may take a while.