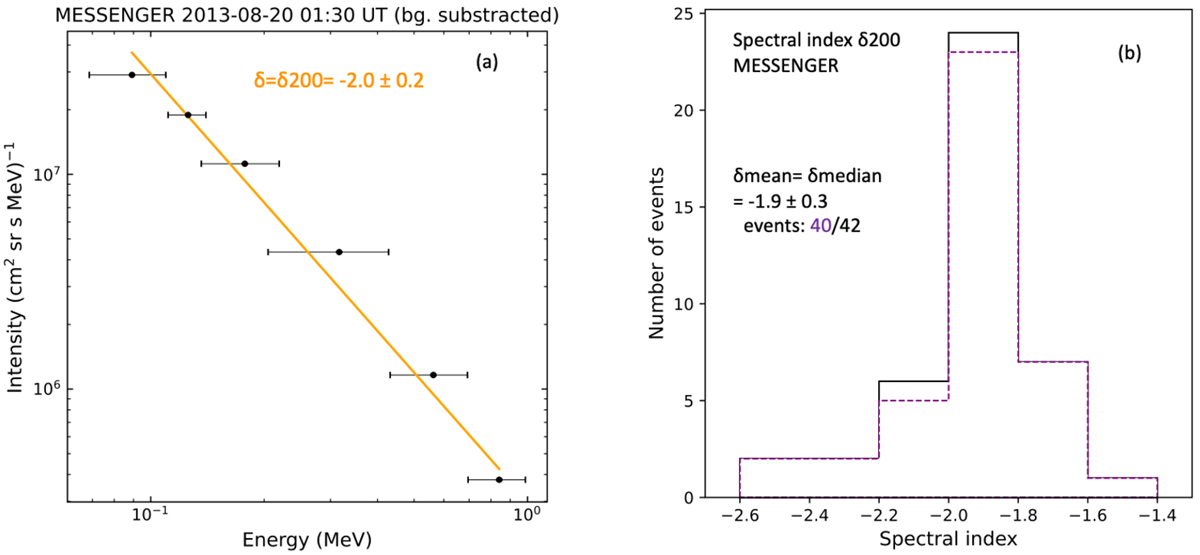
Fig. 5.
Download original image
MESSENGER SEE event peak spectra. (a) Event representative of the peak-intensity energy spectrum, showing a single power law. The spectral index and its uncertainty are given in the legend. (b) Histogram of the spectral indices for the whole sample of events. Mean and standard deviation and median and median absolute deviation values are given in the legend. Purple indicates the events with a CME-driven shock.
Current usage metrics show cumulative count of Article Views (full-text article views including HTML views, PDF and ePub downloads, according to the available data) and Abstracts Views on Vision4Press platform.
Data correspond to usage on the plateform after 2015. The current usage metrics is available 48-96 hours after online publication and is updated daily on week days.
Initial download of the metrics may take a while.