Fig. 3.
Download original image
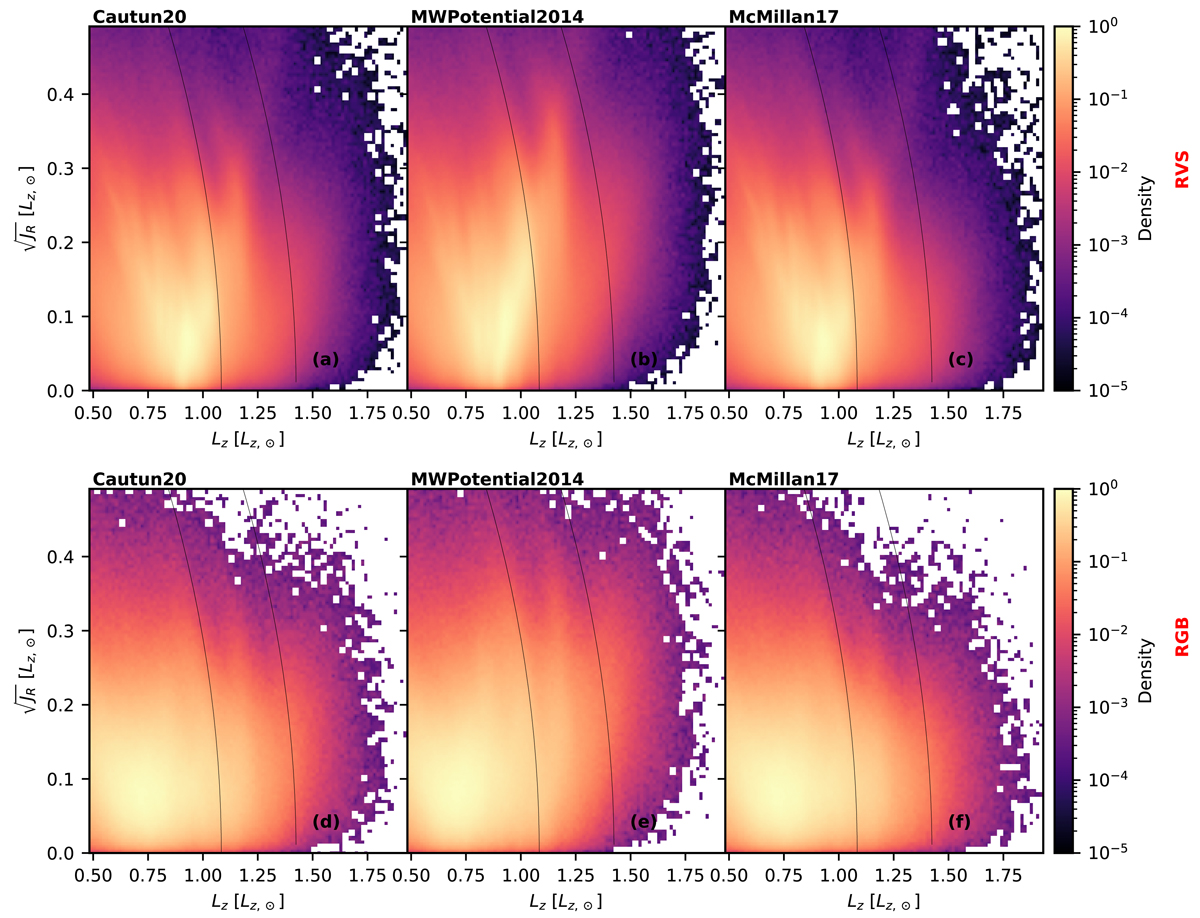
Distribution in (![]() ) plane for the RV (upper panels) and the RGB (lower panels) samples, computed using AGAMA for four different gravitational potentials. Both datasets show diagonal ridges, but the RGB sample extends farther into the outer disc. Beyond 1.42 LZ, ⊙ the density falls off sharply, which makes it harder to distinguish features. The black curves mark the expected OLR of the bar at 1.08 LZ, ⊙ and the Cepheid gap at 1.42 LZ, ⊙.
) plane for the RV (upper panels) and the RGB (lower panels) samples, computed using AGAMA for four different gravitational potentials. Both datasets show diagonal ridges, but the RGB sample extends farther into the outer disc. Beyond 1.42 LZ, ⊙ the density falls off sharply, which makes it harder to distinguish features. The black curves mark the expected OLR of the bar at 1.08 LZ, ⊙ and the Cepheid gap at 1.42 LZ, ⊙.
Current usage metrics show cumulative count of Article Views (full-text article views including HTML views, PDF and ePub downloads, according to the available data) and Abstracts Views on Vision4Press platform.
Data correspond to usage on the plateform after 2015. The current usage metrics is available 48-96 hours after online publication and is updated daily on week days.
Initial download of the metrics may take a while.