Fig. 4.
Download original image
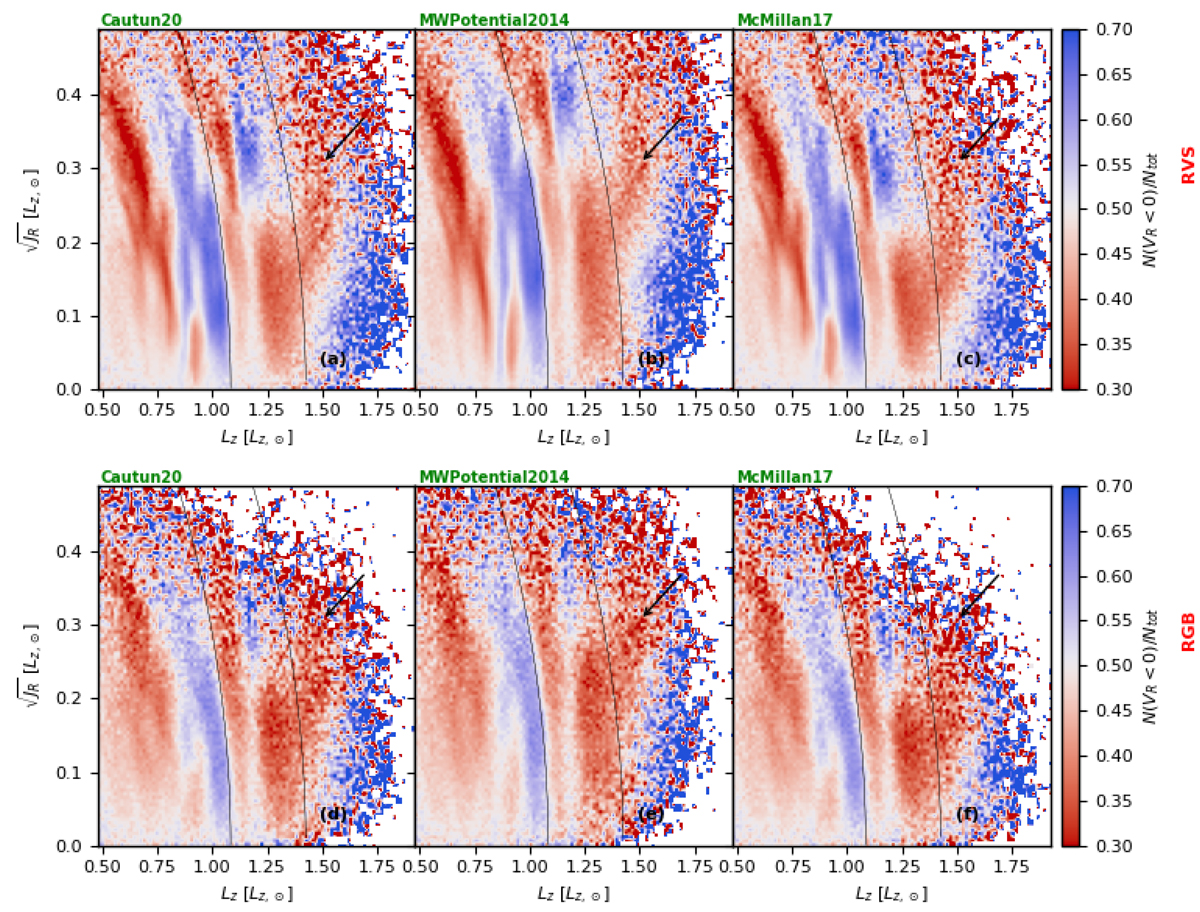
Distribution in the ![]() ) plane for the RV (upper panels) and the RGB (lower panels) samples, computed using AGAMA for four different potentials. Here we colour-code the distribution by the fraction of stars moving inward (VR < 0). The black curves mark the expected OLR of the bar at 1.08 LZ, ⊙ and the Cepheid gap at 1.42 LZ, ⊙. The diagonal ridges are much clearer in this space than in Fig. 3. We report a previously unseen new overdensity of outward-moving stars just beyond the Cepheid gap. This is marked by black arrows.
) plane for the RV (upper panels) and the RGB (lower panels) samples, computed using AGAMA for four different potentials. Here we colour-code the distribution by the fraction of stars moving inward (VR < 0). The black curves mark the expected OLR of the bar at 1.08 LZ, ⊙ and the Cepheid gap at 1.42 LZ, ⊙. The diagonal ridges are much clearer in this space than in Fig. 3. We report a previously unseen new overdensity of outward-moving stars just beyond the Cepheid gap. This is marked by black arrows.
Current usage metrics show cumulative count of Article Views (full-text article views including HTML views, PDF and ePub downloads, according to the available data) and Abstracts Views on Vision4Press platform.
Data correspond to usage on the plateform after 2015. The current usage metrics is available 48-96 hours after online publication and is updated daily on week days.
Initial download of the metrics may take a while.