Open Access
Fig. 8.
Download original image
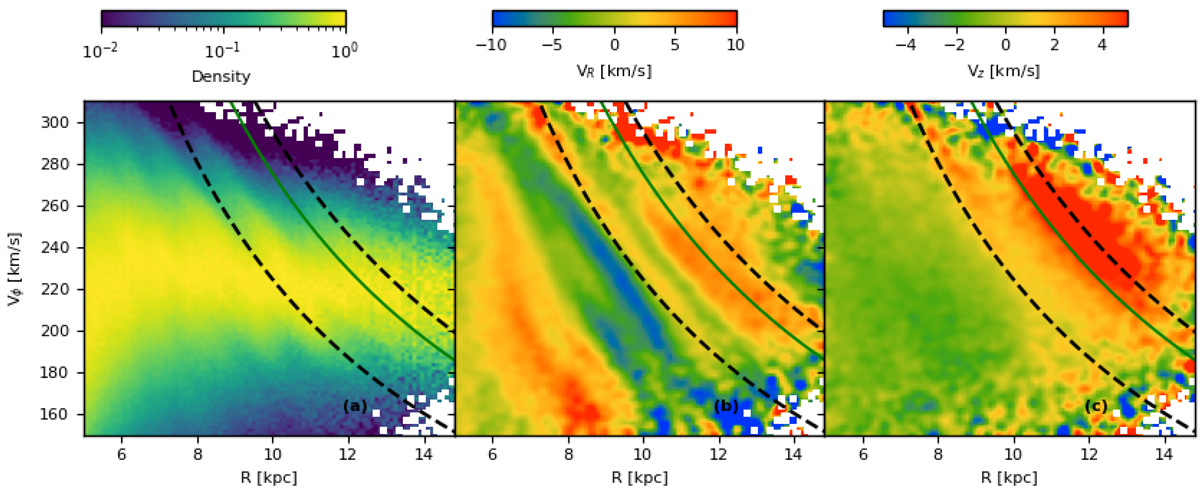
The RGB sample shown in the Vϕ − R space in density (panel a), median VR (panel b), and median VZ (panel c). The two black dotted lines are the locations of the expected OLR and the 1:1 resonance of the Galactic bar. The green solid line marks the location of the discontinuity seen in AC21 and MC22.
Current usage metrics show cumulative count of Article Views (full-text article views including HTML views, PDF and ePub downloads, according to the available data) and Abstracts Views on Vision4Press platform.
Data correspond to usage on the plateform after 2015. The current usage metrics is available 48-96 hours after online publication and is updated daily on week days.
Initial download of the metrics may take a while.