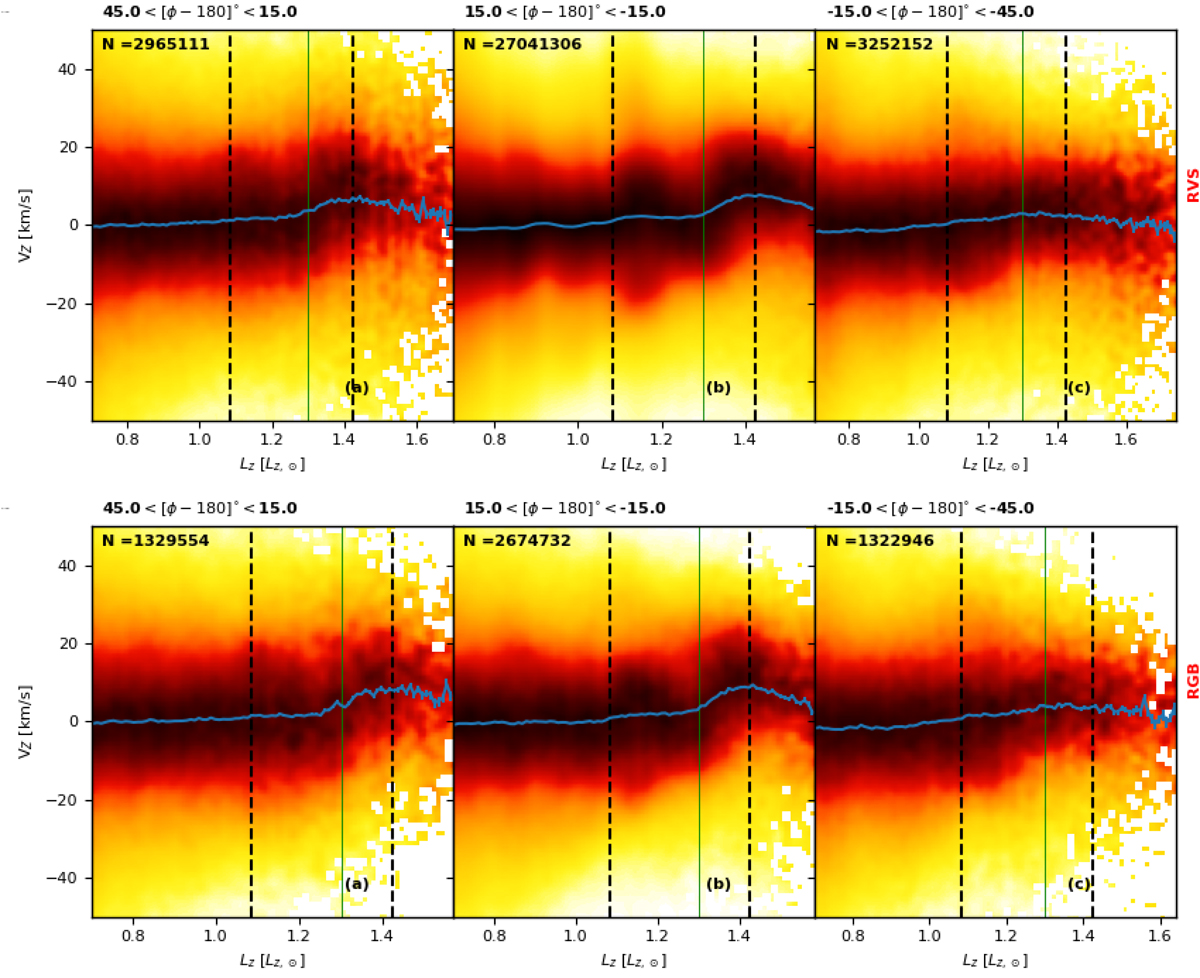
Fig. 9.
Download original image
Distribution of the RV and RGB samples in vertical velocity VZ against LZ. The panels divide the data into three bins of 30° width in the azimuth angle, which increases in the direction of Galactic rotation. The middle panel covers stars about 15° either way of the Galactic anticentre. Two dashed black lines are plotted at the positions of the OLR (1.08 LZ, ⊙), and at the Cepheid gap (1.424 LZ, ⊙) in Fig. 2. The vertical green line marks the discontinuity (1.3 LZ, ⊙) noted in recent papers (Gaia Collaboration 2021b; McMillan et al. 2022).
Current usage metrics show cumulative count of Article Views (full-text article views including HTML views, PDF and ePub downloads, according to the available data) and Abstracts Views on Vision4Press platform.
Data correspond to usage on the plateform after 2015. The current usage metrics is available 48-96 hours after online publication and is updated daily on week days.
Initial download of the metrics may take a while.