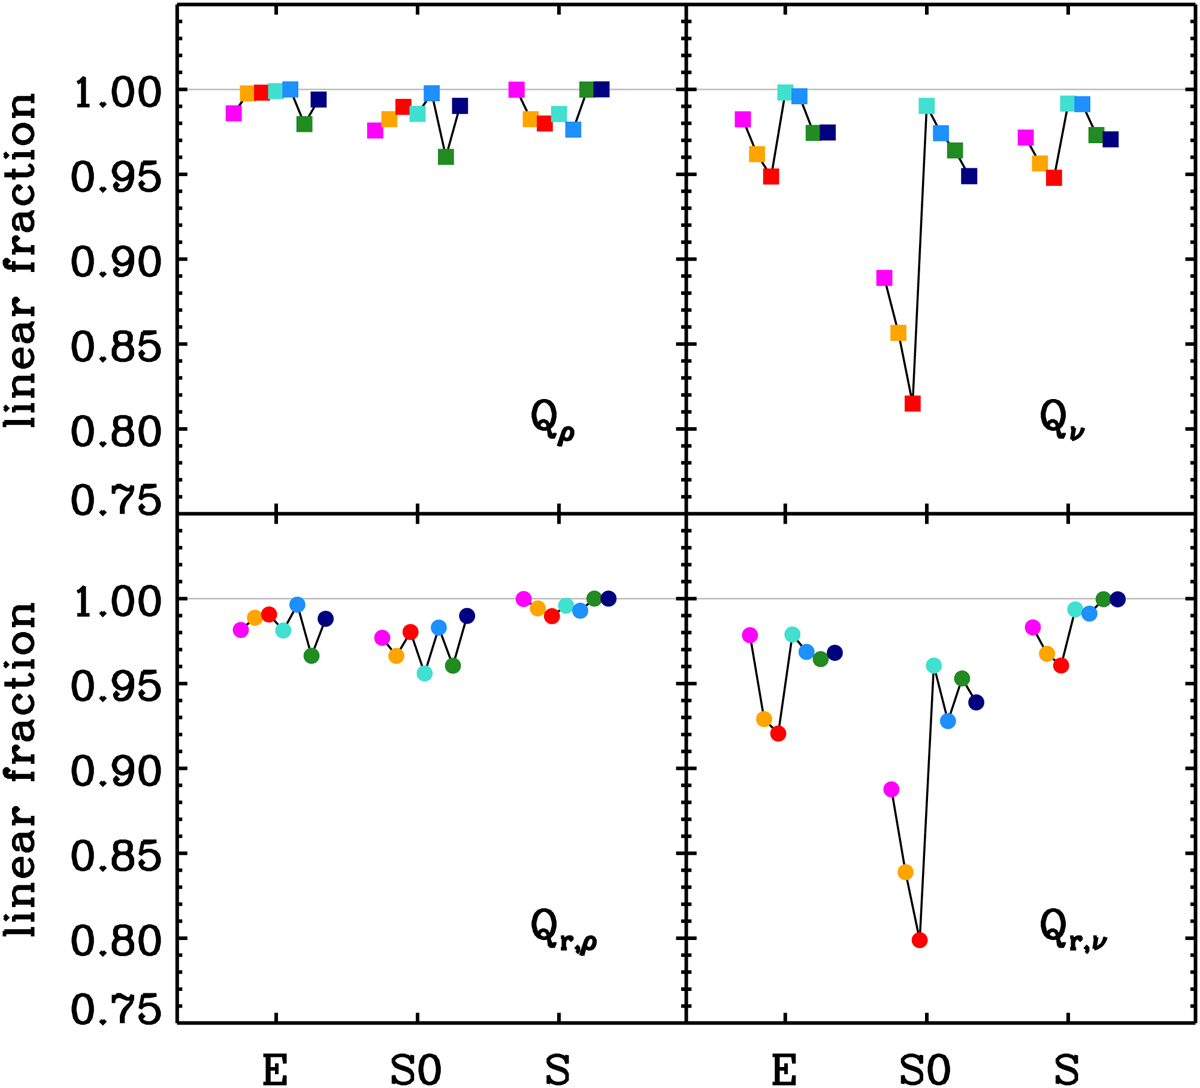
Fig. 2.
Download original image
Fraction of linear, l ≥ 0.9, relations deduced from the MCMC chain elements, for E, S0, and S tracers, in different models (color coded as in Table 1) for the sigv scaling, using total mass density profile (left) and tracer number density profiles (right), with total velocity dispersion (top) and radial velocity dispersion (bottom). Error bars are smaller than the symbol sizes.
Current usage metrics show cumulative count of Article Views (full-text article views including HTML views, PDF and ePub downloads, according to the available data) and Abstracts Views on Vision4Press platform.
Data correspond to usage on the plateform after 2015. The current usage metrics is available 48-96 hours after online publication and is updated daily on week days.
Initial download of the metrics may take a while.