Fig. 3.
Download original image
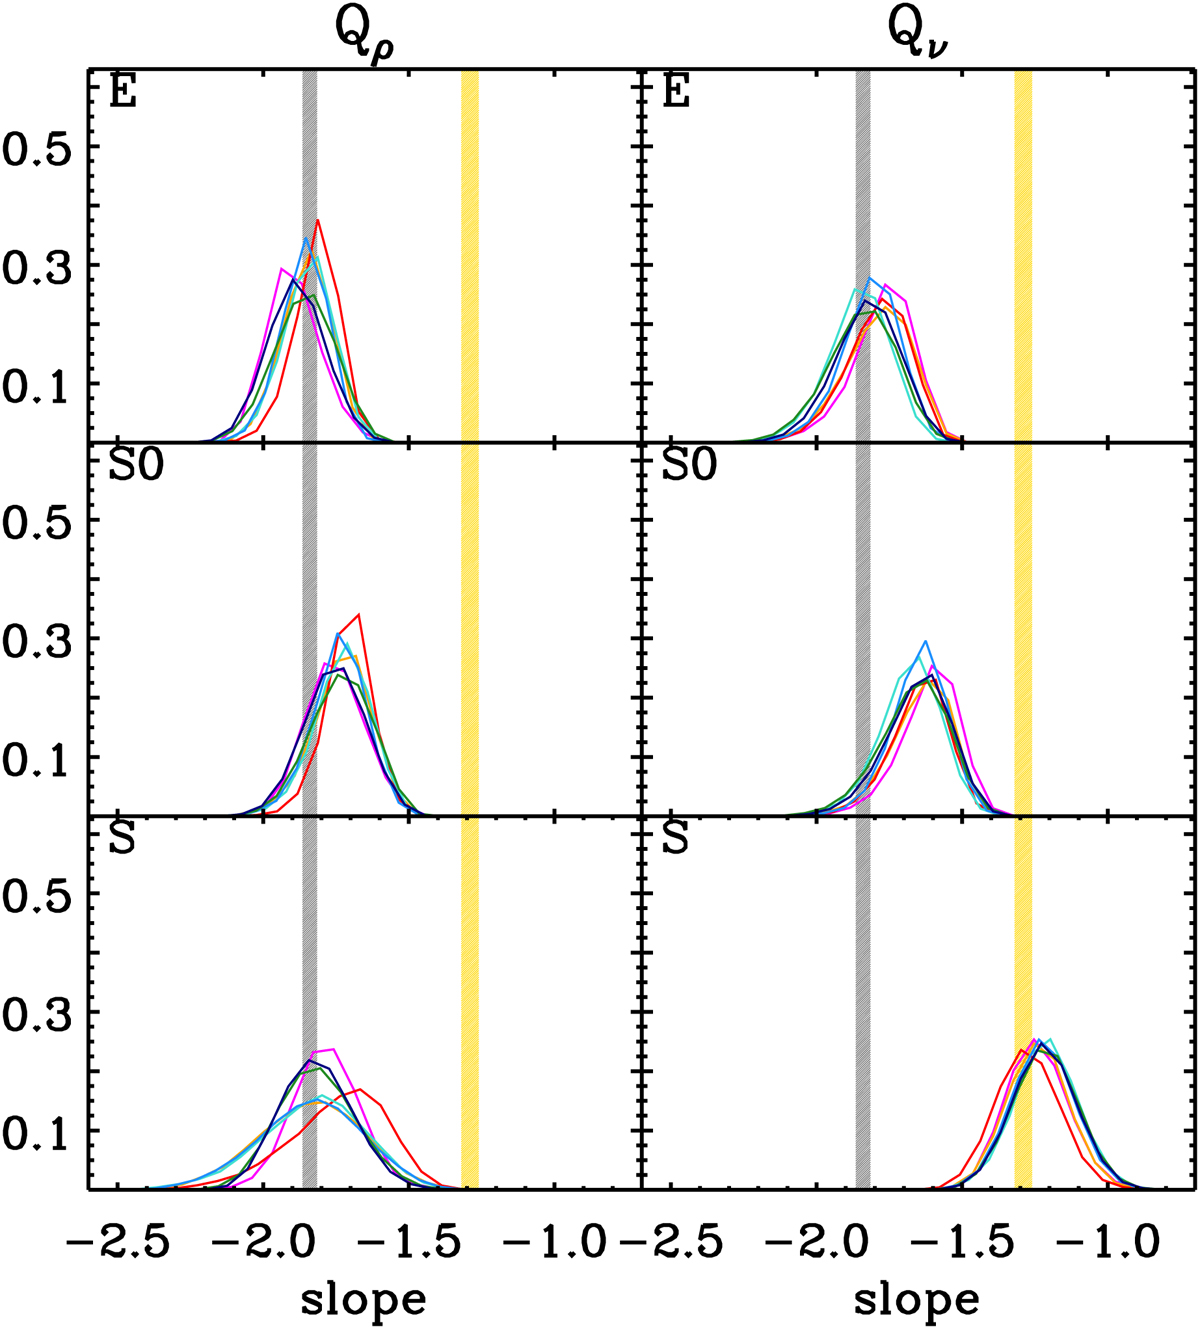
Marginal distributions of the logarithmic slopes of the linear (l ≥ 0.9) Q profiles, for different morphological classes (E, S0, S in the top, middle, and bottom panel, respectively) using different models (color coded as in Table 1), for sigv scaling. Left panels: Qρ; right panels: Qν. Grey (respectively yellow) shadings indicate the simulation-based prediction for the slope of DM tracers (respectively subhalos), −1.84 ± 0.025 (respectively −1.29 ± 0.03).
Current usage metrics show cumulative count of Article Views (full-text article views including HTML views, PDF and ePub downloads, according to the available data) and Abstracts Views on Vision4Press platform.
Data correspond to usage on the plateform after 2015. The current usage metrics is available 48-96 hours after online publication and is updated daily on week days.
Initial download of the metrics may take a while.