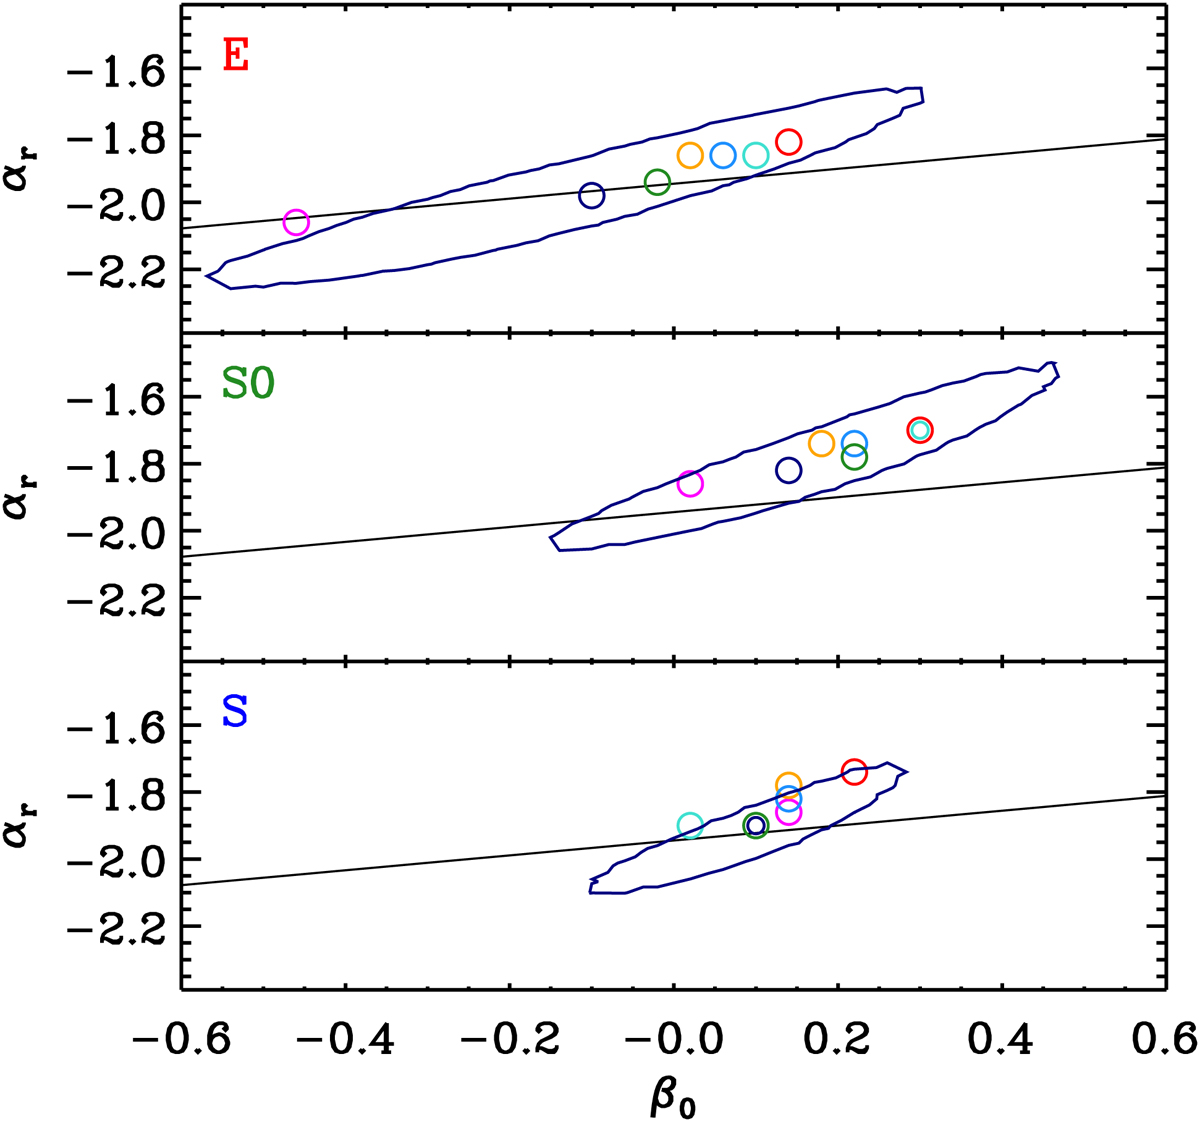
Fig. 7.
Download original image
Distributions of Qr, ρ logarithmic slopes vs. central velocity anisotropy, β0 for the E (top panel), S0 (middle panel), and S (bottom panel) classes. Dots indicate the peaks of the density distribution of the MCMC chain elements in this diagram, for the different models (color coded as in Table 1). The contour contains 68% of the MCMC chain elements for model 15e (navy blue). We omit the contours of the other models for the sake of clarity. The solid line is the relation αr = − 35/18 + 2/9 β0 from Dehnen & McLaughlin (2005).
Current usage metrics show cumulative count of Article Views (full-text article views including HTML views, PDF and ePub downloads, according to the available data) and Abstracts Views on Vision4Press platform.
Data correspond to usage on the plateform after 2015. The current usage metrics is available 48-96 hours after online publication and is updated daily on week days.
Initial download of the metrics may take a while.