Fig. 8.
Download original image
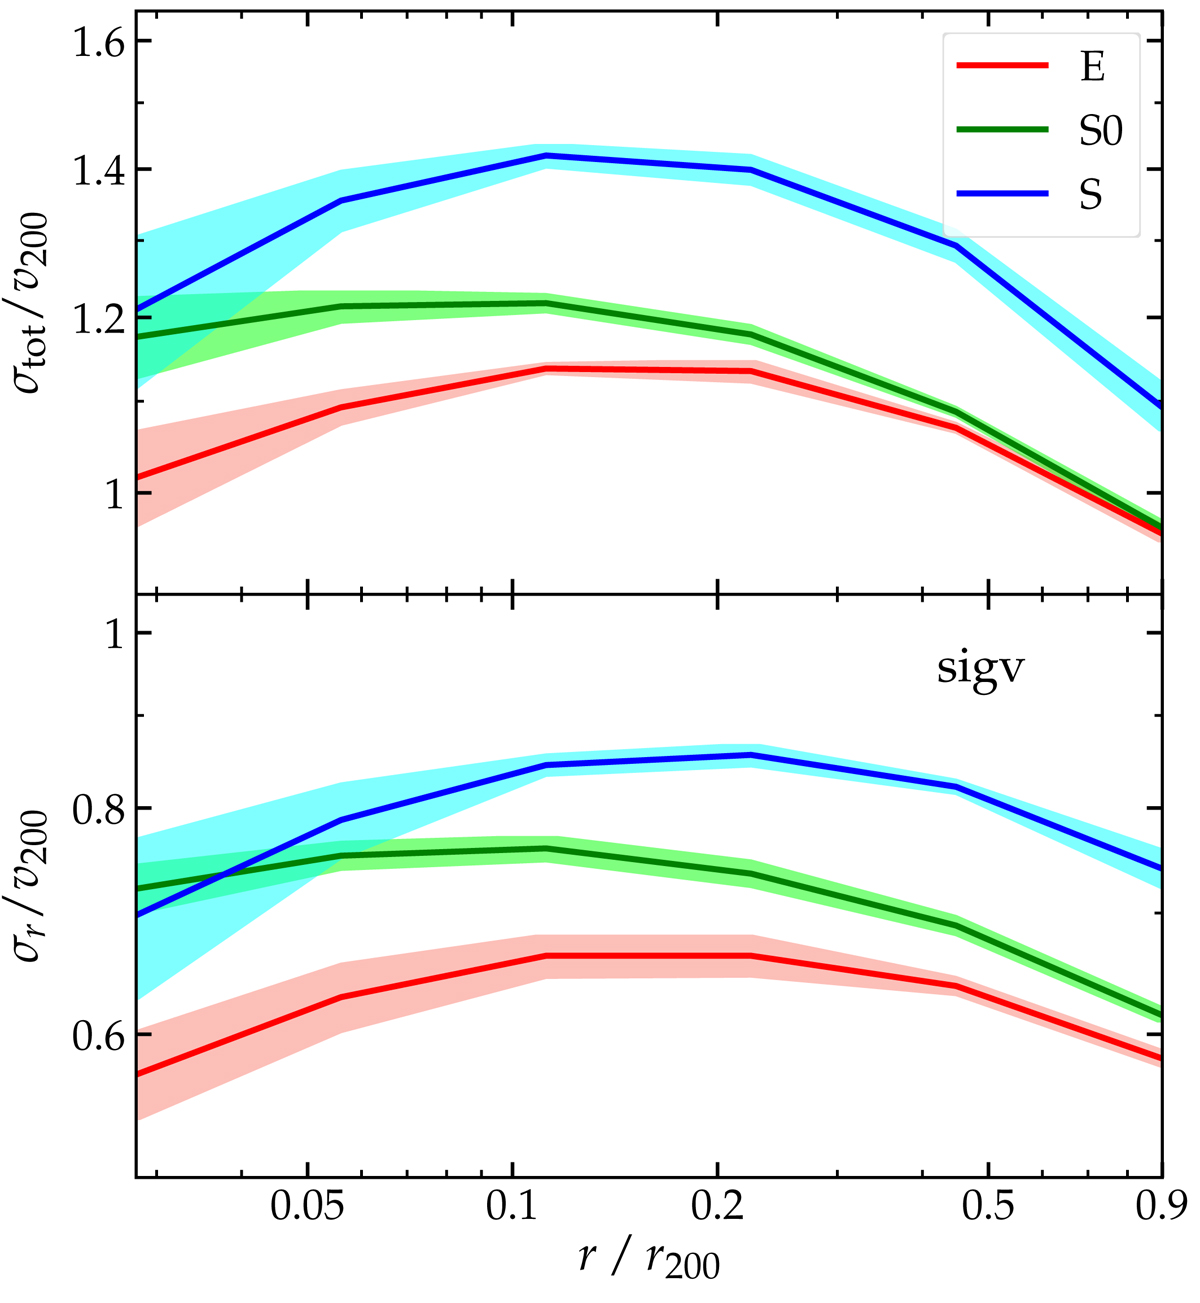
Velocity dispersion profiles: total (top panel) and radial component (bottom panel) for the ellipticals (solid red line and pink shading), S0s (dash-dotted green line and light green shading), and spirals (dashed blue line and cyan shading). The curves are the biweight averages over all seven models and the shadings are the dispersions among the seven models.
Current usage metrics show cumulative count of Article Views (full-text article views including HTML views, PDF and ePub downloads, according to the available data) and Abstracts Views on Vision4Press platform.
Data correspond to usage on the plateform after 2015. The current usage metrics is available 48-96 hours after online publication and is updated daily on week days.
Initial download of the metrics may take a while.