Fig. 4
Download original image
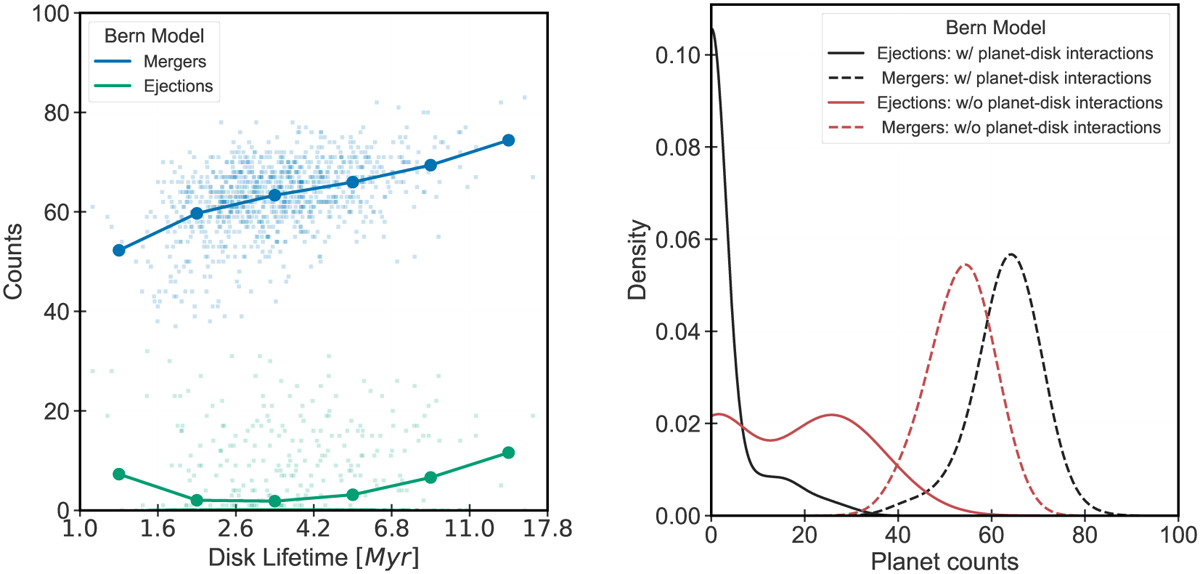
Effect of planet–disk interactions on architecture. Left: scatter plot shows the number of planet–planet mergers and planetary ejections that occurred in systems as a function of disk lifetime. The solid lines show the average counts for each disk lifetime bin. Right: distribution of the total number of mergers (dashed) and ejections (solid) for the entire synthetic population. The black line depicts the nominal synthetic population, and the red line depicts a different synthetic population in which the disk–planet interactions were artificially switched off.
Current usage metrics show cumulative count of Article Views (full-text article views including HTML views, PDF and ePub downloads, according to the available data) and Abstracts Views on Vision4Press platform.
Data correspond to usage on the plateform after 2015. The current usage metrics is available 48-96 hours after online publication and is updated daily on week days.
Initial download of the metrics may take a while.