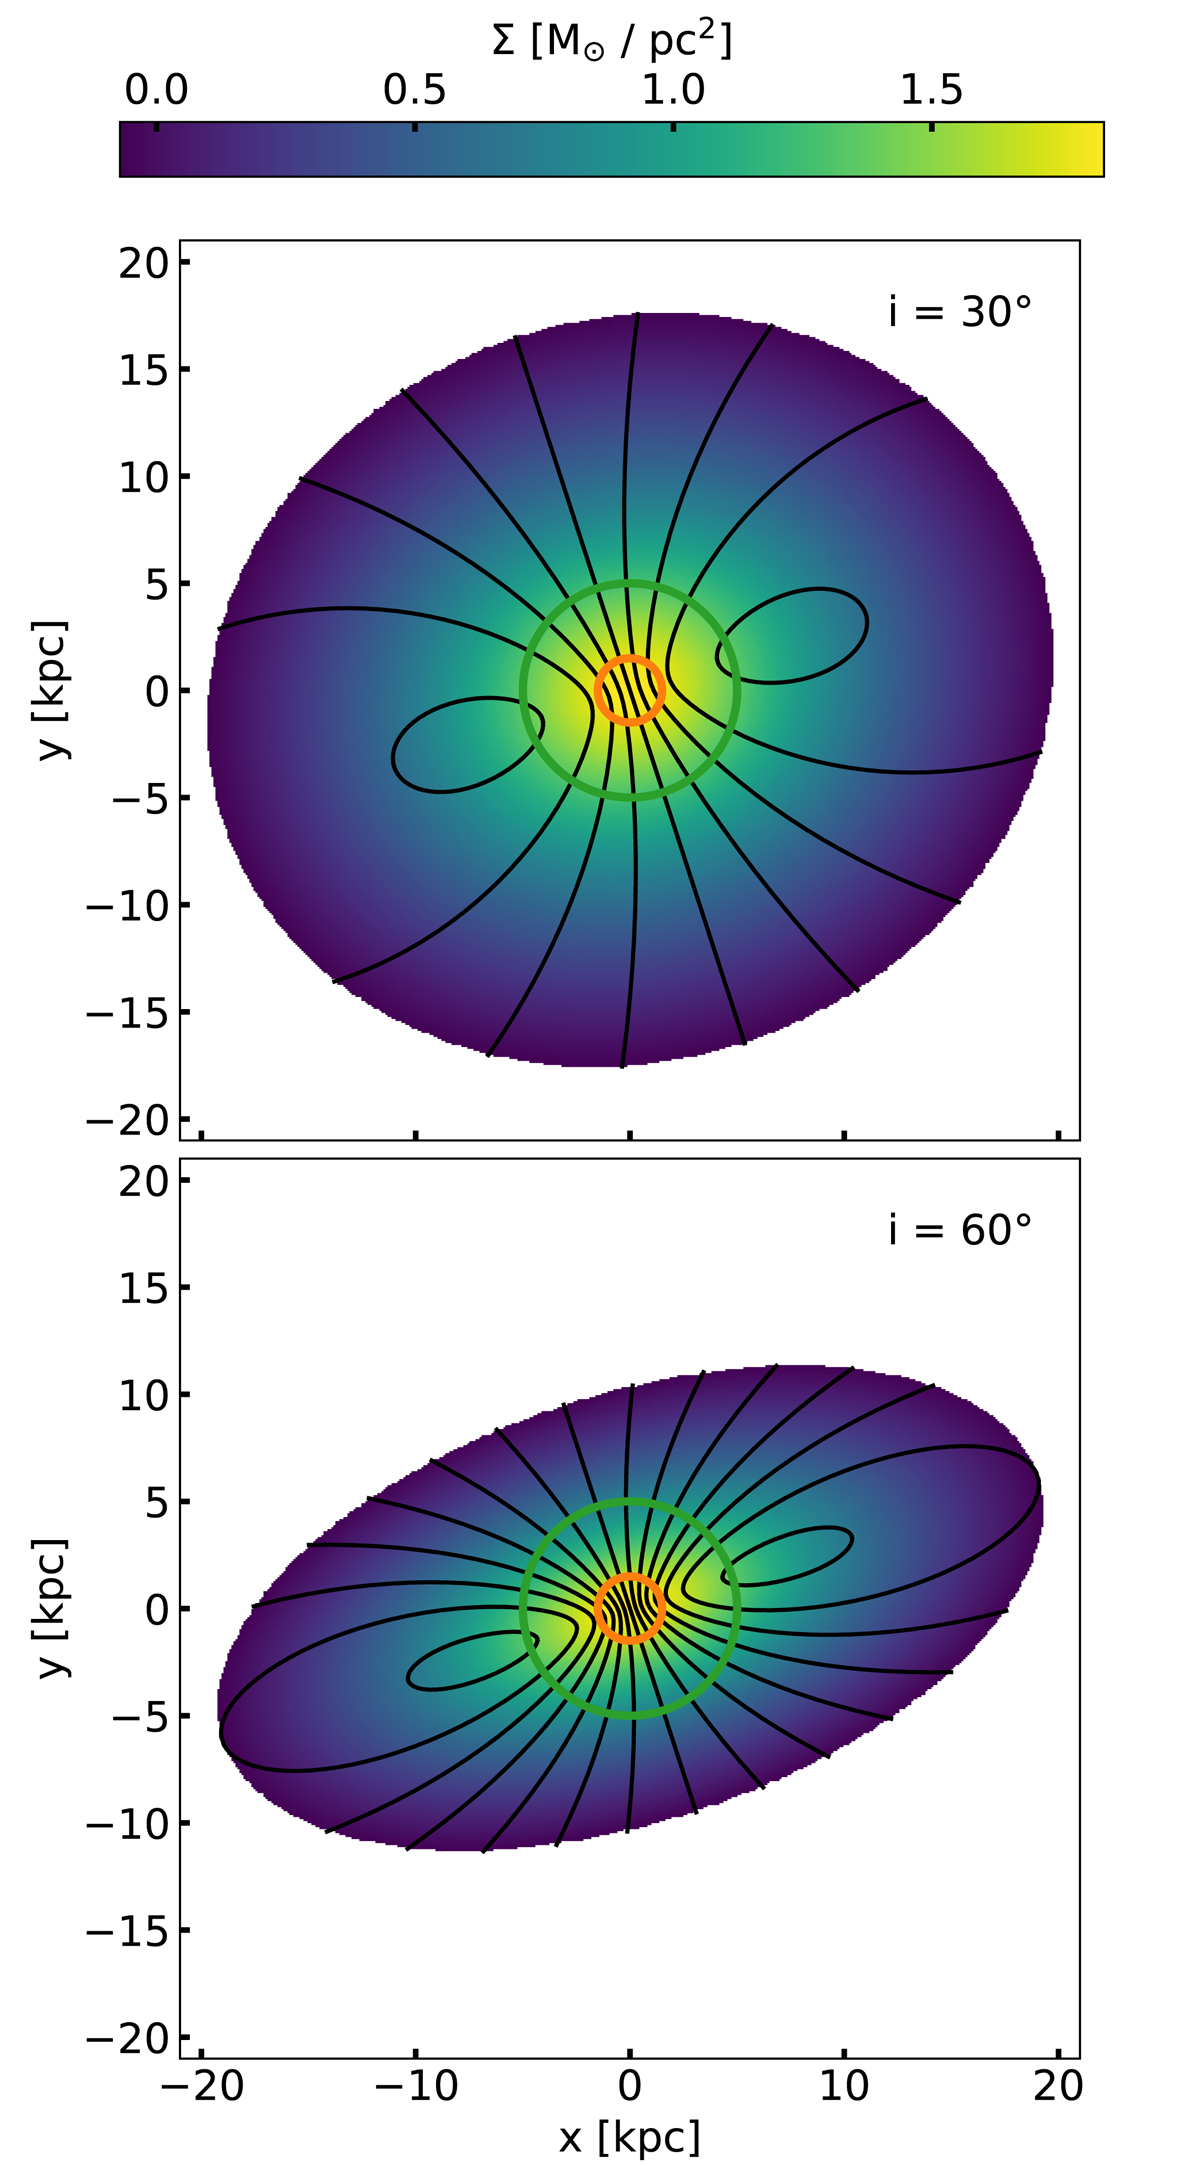
Fig. 3.
Download original image
Gaseous disc model at two different inclinations. We show 2D projections of a Miyamoto–Nagai density profile as described in Eq. (1) at an inclination of i = 30° (top panel) and i = 60° (bottom panel). Both discs are turned by a position angle of 20°. The colour-bar indicates the surface density. With black lines, we indicate iso-velocity curves, with velocity values separated by 30 km s−1 (with a value of 0 km s−1 on the minor axes). With an orange (resp. green) circle, we show the area observed by a 3″ spectroscopic fibre at a redshift of z = 0.05 (resp. z = 0.17). The more inclined the disc, the smaller the distance of equidistant velocity lines and thus the steeper the velocity gradient probed by the spectroscopic fibre.
Current usage metrics show cumulative count of Article Views (full-text article views including HTML views, PDF and ePub downloads, according to the available data) and Abstracts Views on Vision4Press platform.
Data correspond to usage on the plateform after 2015. The current usage metrics is available 48-96 hours after online publication and is updated daily on week days.
Initial download of the metrics may take a while.